Data Visulaization Generator
The best 50 Data Visulaization Generator AI tools - Free & Paid
Explore 50 AI for Data Visulaization Generator

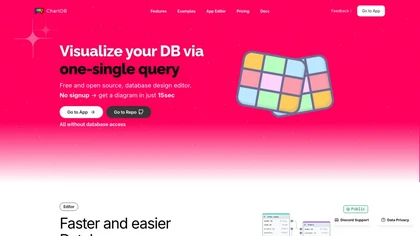
ChartGen.ai is an AI chart generator that converts CSV/Excel data or pasted text into presentation-ready visualizations using plain-English prompts. It supports numerous chart types, offers live data sync, and exports in multiple formats with enterprise-grade security.
Freemium

vizGPT turns natural‑language queries and drag‑and‑drop into live dashboards and charts, retaining context for follow‑ups. It includes data tables for profiling and transforms, and design tools that generate Lottie JSON and SVG animations, enabling team collaboration.
Paid
- $10/mo
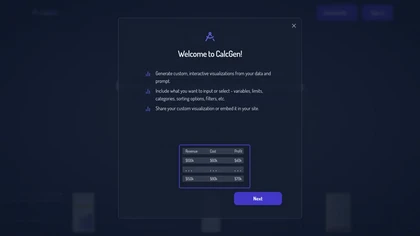
Calcgen AI enables users to create custom interactive charts, graphs, and calculators for data visualization. It includes tools for financial analysis, scientific calculations, and educational purposes, catering to a broad range of professional needs.
Subscription

ChartAI auto‑creates diverse visualizations—mind maps, flowcharts, timelines, Gantt charts, ER diagrams, etc.—by converting data into polished diagrams. It offers templates, quick start, and dataset generation, aiding analysts, researchers, educators, and managers.
Free

Free AI Graph Maker enables users to create interactive charts and graphs, including bar, pie, and line charts. It supports Gantt charts, flowcharts, and mind maps, facilitating effective data visualization for various sectors like education and finance.
Freemium

Graphy transforms raw data from Google Sheets, CSV, Excel, or APIs into AI‑generated charts, auto‑highlighting insights. It supports multiple chart types, branding, annotations, real‑time updates, and export/embed options for marketing, finance, and consulting teams.
Freemium
- $16/mo
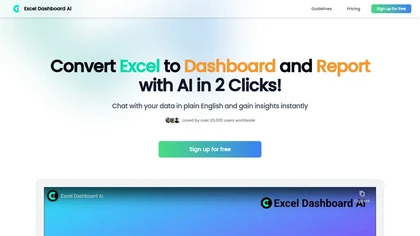
ExcelDashboard AI transforms Excel data into interactive dashboards and reports with minimal effort. Users can generate insights using plain English, automate visualizations, and customize analyses, making it suitable for both beginners and experienced data analysts.
Free trial

ChartGPT is an AI tool that facilitates easy creation and customization of multiple chart types for enhanced data visualization. It provides versatility in displaying data through various charts, ensuring clear and captivating presentations for diverse projects.
Freemium
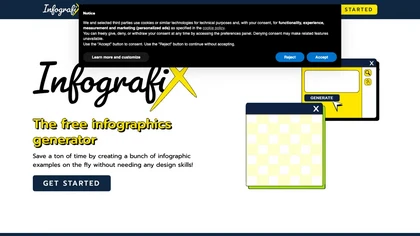
Infografix leverages Azure AI to turn text prompts into infographics—timelines, mind maps, SWOT analyses, family trees, and more—using templates, over 1,500 Google Fonts, and direct canvas editing. Export to PNG, JPG, SVG, PDF and share on social media.
Free
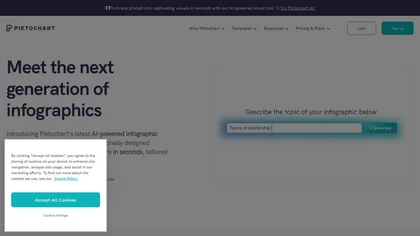
Piktochart is an AI‑powered visual creation platform that turns text into infographics, charts, and videos within seconds. It offers templates, a brand kit, collaborative editing, interactive graphics, and export options for print and digital use.
Freemium

SciDraw AI is a scientific illustration and data visualization tool that converts text prompts, sketches, or images into publication-ready figures. It generates editable SVG/PPTX exports, data-driven charts from CSV/Excel, and supports journal style presets and colorblind-friendly palettes for repro
Free trial
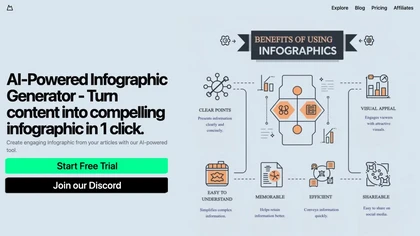
Transforms raw data into instant infographics with a single AI‑click workflow. Auto‑generates captions, offers full editing of text, images, colors, and real‑time online search. Ideal for designers, marketers, educators, and social media managers.
Freemium
- $9.99/mo

InfographAI converts text, URLs, PDFs, Word docs, and spreadsheets into AI-generated infographics. It extracts key points, auto-places charts and visuals, offers customizable templates and a drag-and-drop editor, and exports PNG or PDF for reports and social media.
Freemium
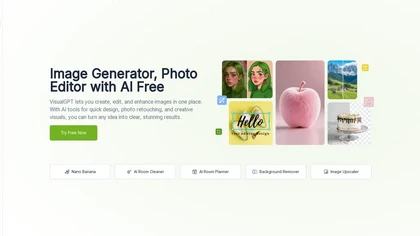
VisualGPT is an AI image generator and editor, offering features like background removal, photo retouching, and interior design visualization. It supports models such as Nano Banana and Flux, facilitating bulk processing and social media content creation.
Free trial
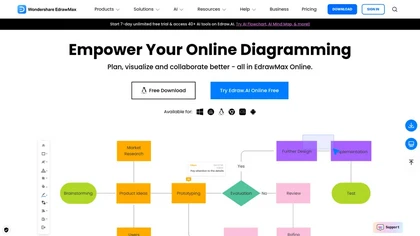
EdrawMax Online is a cloud diagramming platform with 210+ diagram types, including flowcharts, UML, and Gantt charts. It offers drag‑and‑drop editing, real‑time collaboration, 20,000 free templates, 26,000 symbols, and AI tools for diagram, chart, and PPT generation, OCR, and copy‑writing.
Freemium
- $5.33/mo
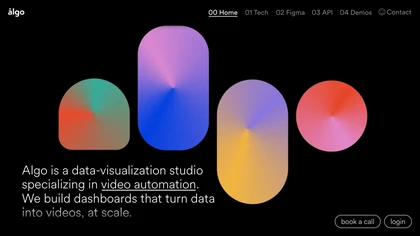
Algo transforms structured data into motion graphics, automating end‑to‑end video creation. Teams ingest data, storyboard, and animate via a dashboard, then the cloud renders and distributes live, data‑driven videos for web, social, or broadcast.
Freemium
ChartPixel is an AI tool that generates charts and insights from messy data files or webpages using AI algorithms to clean and engineer new features, provide AI-assisted annotations and statistics to explore patterns and quirks in the data.
Freemium


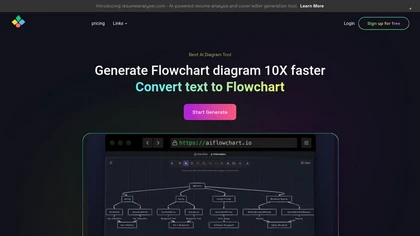
AI Flowchart is a diagram generation tool that creates various visual formats, such as flowcharts and pie charts, from different data sources. It offers customization options and an iterative recreation feature for enhanced diagram design efficiency.
Freemium
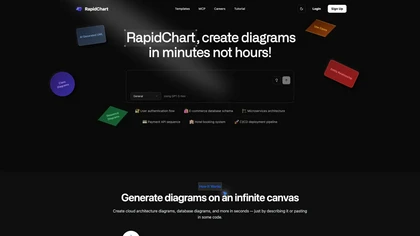
RapidChart is an AI-driven UML diagram generator that allows software developers and architects to create various diagrams quickly, including UML, C4 model, and neural network visualizations, using an infinite canvas and intelligent auto-layout features.
Free

Genaraera is an AI tool that creates infographics from user-provided data, offering various formats like charts and timelines. Users can upload reference images and generate high-resolution visuals without requiring design expertise.
Subscription
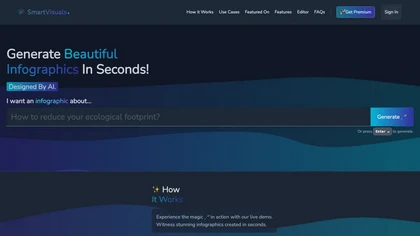
SmartVisuals.app is an AI‑driven infographic generator that creates professional visual summaries in seconds. Its drag‑and‑drop editor, industry templates, and automatic layout suggestions streamline design for marketers, educators, analysts, and teams, supporting exports in PNG, JPEG, or SVG.
Free trial

Grok.com uses Cloudflare's bot protection to detect and filter automated traffic via a verification page that runs checks (often requiring JavaScript). Operators gain access control, security event logging and preserved site performance while users complete brief verification.
Freemium
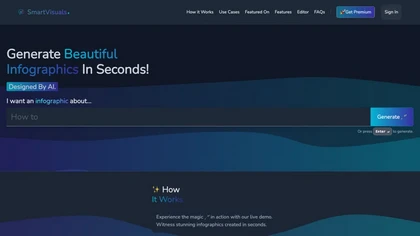
SmartVisuals.app is an AI‑powered infographic creator that produces data visualizations in seconds. With a drag‑and‑drop editor, template library, and export to SVG, PNG, PDF, it offers customization of layout, color, typography, and branding, supporting multiple languages for global use.
Free trial
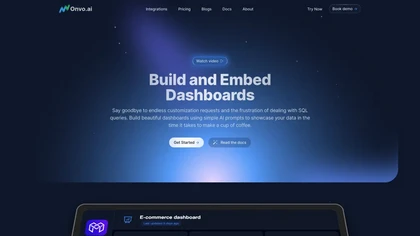
Onvo AI revolutionizes data visualization through AI prompts, enabling users to easily generate tailored charts and dashboards without intricate queries. It ensures secure sharing, supports multiple data source integrations, and provides SDKs for smooth product incorporation.
Free trial
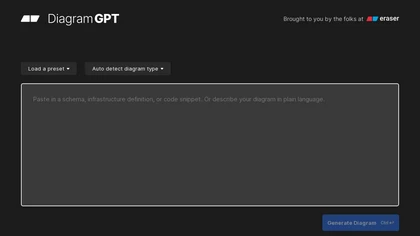
DiagramGPT turns natural‑language prompts into architecture, sequence, BPMN, flowchart, ERD, and cloud diagrams. Users pick templates, view use‑case videos, edit in code‑based Eraser, and export to documentation tools. Collaboration, dark mode, and API support are included.
Freemium

Grapha.ai is an AI-enabled data exploration tool that swiftly reveals hidden trends and provides intuitive visualizations & insights from complex datasets without requiring any coding knowledge.
Subscription
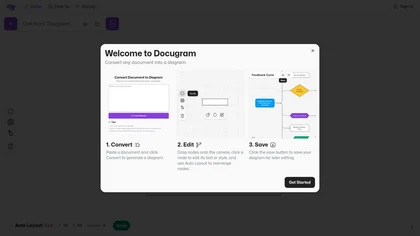
Docugram transforms text into visual diagrams like decision trees and flowcharts, enhancing clarity of complex information. It features editable nodes, auto layout for professional appearances, and easy saving for future editing, ideal for professionals communicating processes effectively.
Subscription

Pie Chart Maker lets users quickly create pie, doughnut, and 3‑D charts by entering comma‑separated labels and values. Adjust colors, legend placement, and rotation; export to PNG, JPEG, or SVG. Ideal for students, teachers, designers.
Free

DGM is an AI-powered, free online diagramming tool with advanced features. It provides smart shapes (UML, ERD, flowcharts, UI wireframes) and code generation assistance. Key attributes include cloud storage, hand-drawn styles, web publication, and upcoming real-time collaboration.
Free
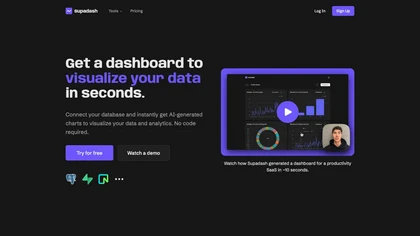
Supadash lets users connect to SQL databases like PostgreSQL or Supabase and automatically turns SELECT results into time‑series and bar charts without manual coding. It supports unlimited charts per project, offers AI‑generated layouts, and stores no user data.
Subscription
- $7/mo

Visualizee.ai turns plain‑language descriptions into photorealistic 2K/4K renders and motion videos for architects, designers, and developers. Its conversational AI, multi‑language support, and context‑aware geometry enable quick lighting, material, and batch image transformations.
Freemium
- $15/mo
Edraw Software is a versatile diagramming tool that enables users to create flowcharts, mind maps, and organizational charts with ease. Its drag-and-drop functionality, collaboration features, and support for multiple file formats enhance productivity and integration.
- $59
Datviz AI is a data visualization tool that leverages OpenAI's language model to analyze complex datasets and generate insightful charts. It offers an intuitive interface for creating diverse visualizations like bar charts, heatmaps, and geomaps to support data-driven decisions.
Freemium
ImageGeneratorAI.io is a browser-based AI image generator that transforms text prompts into high-resolution visuals using models like SDXL and Flux. It offers extensive customization for style, aspect ratio, and composition, enabling rapid creation of marketing assets, concept art, and social media
Free
Sheetgod converts plain‑English queries into Excel, VBA, and Google Apps Script code, automating complex spreadsheet tasks, generating PDFs, sending emails, and creating custom add‑ons, reducing manual effort and boosting productivity for analysts and finance professionals.
Freemium
- $129/mo

Julius AI is a data analyst assistant that connects to Excel, Google Sheets, and PostgreSQL to generate bar charts, histograms, heat maps automatically. It offers interactive, customizable visualizations, embeddable into reports, and exports cleaned data for stakeholders.
Freemium
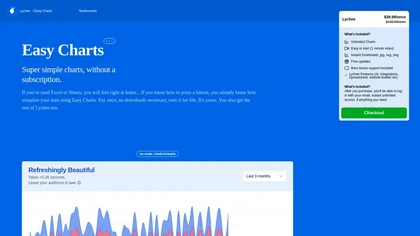
Easy Charts is an AI-powered tool for data visualizations and charts generation without the need for downloads. It offers unlimited chart generation, easy exports, and customization options, making charting effortless for all user levels.
Paid
- $39.99

AI Infographic Generator converts text and data into customizable graphics like infographics and flowcharts. With over 500 templates and multi-language support, it enables editing and downloading in multiple formats, all while supporting 4K resolution.
Freemium
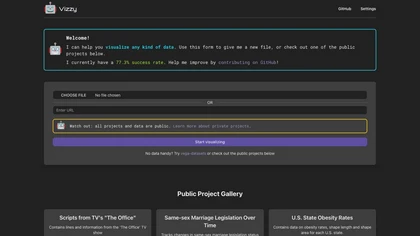
Vizzy turns user data or public datasets into charts and dashboards using large language models. It runs entirely in the browser, stores the OpenAI API key locally, and supports private projects with visibility controls—no coding required.
Paid
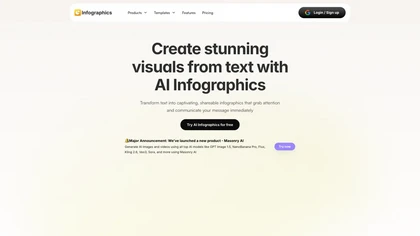
AI Infographics converts text into customizable visuals, such as roadmaps and timelines, enhancing data presentation for reports and presentations. Its intuitive interface streamlines the creation process, allowing users to download in formats like PNG and SVG for easy sharing.
Free trial

Vitral is an AI-driven platform for data visualization and reporting, offering intuitive tools for creating dynamic dashboards and automated reports. It supports real-time collaboration and integrates with various data sources for efficient data presentation.
Subscription
Seedance Video Generator is an AI-powered tool that transforms static images into dynamic videos using the Seedance 1.0 Pro model. It offers image-to-video and text-to-video modes, delivering fluid motion and high-quality outputs with precise prompt adherence.
Freemium