What is Line Graph maker?
Line Graph Maker allows users to quickly create line charts in PNG, JPG, or SVG format.
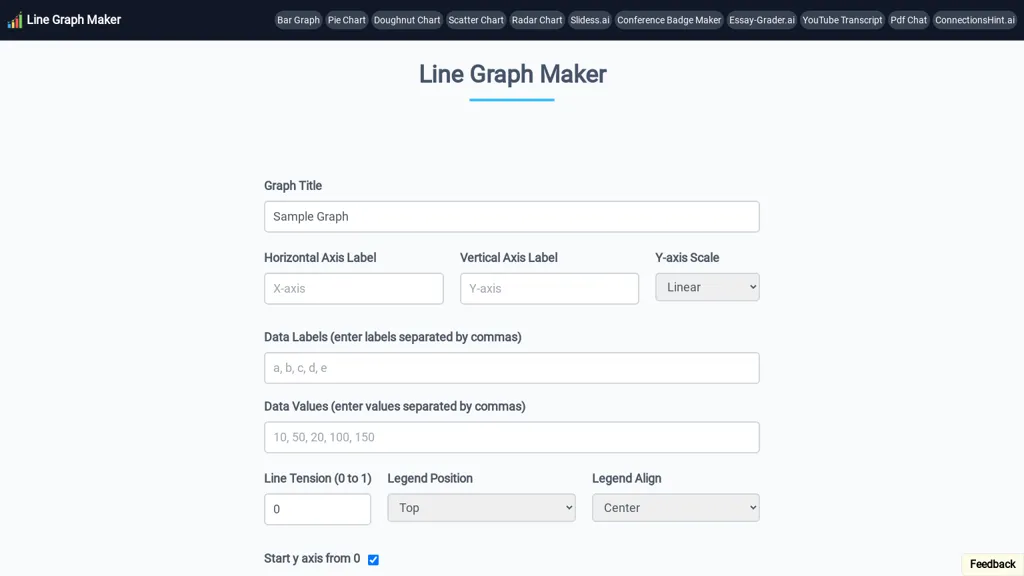
The interface provides controls for graph title, horizontal and vertical axis labels, and Y‑axis scaling (linear or logarithmic).
Users can input data labels and values as comma‑separated lists, adjust line tension from 0 to 1, and set legend placement.
Additional options let users start the Y‑axis at zero, toggle X and Y grid lines, and customize point selection and line color.
After configuration, the chart can be downloaded for reports, presentations, or educational use.
This free tool serves educators, students, and business analysts who need a straightforward line‑chart generator.
Line Graph maker user reviews
Based on 5 reviews, 60.0% of users recommend Line Graph maker, rated highly for quality results.
Liked for
Disliked for
Would you recommend Line Graph maker?
Line Graph maker's key features
-
Add title to line chart
-
Set horizontal axis label
-
Set vertical axis label
-
Choose y-axis scale linear/log
-
Enter data labels comma-separated
-
Enter data values comma-separated
-
Adjust line tension 0 to 1
Line Graph maker use cases
-
Create a line chart of monthly sales data for a small business report using Line Graph Maker without needing Excel, allowing quick adjustment of titles and colors for stakeholder presentation
-
Generate a dynamic performance trend graph for student grades in an educational dashboard, exporting the chart as SVG for inclusion in PDF reports
-
Build a real-time monitoring line chart of server response times in a DevOps toolset, downloading the PNG for embedding in monitoring documentation
Who is it for?
-
Data visualizers
-
Report writers
-
Statistical analysts
-
Business strategists
-
Presentation designers