What is Graphy.app?
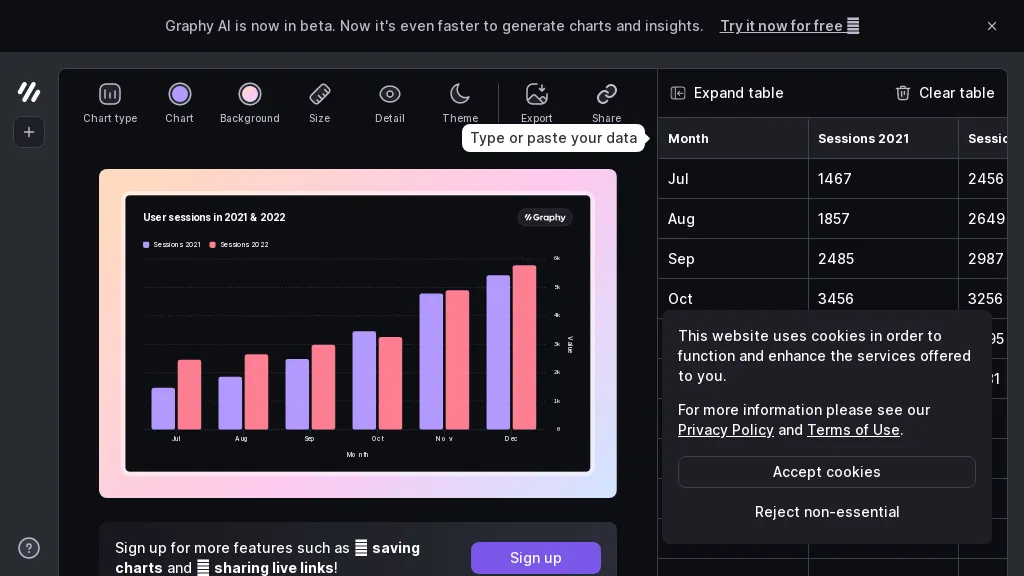
Graphy allows users to convert raw datasets from Google Sheets, CSV, Excel, or APIs into visual charts using AI. The tool ingests data without formatting and highlights key insights automatically. Users can select from multiple chart types, apply brand colors and fonts, and add annotations to emphasize important points.
Results can be exported or embedded for slides, social media, or documents. The platform supports real‑time updates via live data links, helping teams share consistent information. It is useful for marketing analysts, product managers, finance teams, and consultants who need quick, clear data visualizations.
Graphy.app pricing Freemium
Free
$0
Plus
$16 per user/mo
Business
$36 per user/mo
Verify on the official pricing page.
View plansGraphy.app user reviews
Would you recommend Graphy.app?
Recommend this tool?
Graphy.app's key features
-
Upload CSV, Excel, or Google Sheets
-
Import data via API
-
AI auto-generates insights
-
Chat-based chart generation
-
Custom brand colors and fonts
-
Add annotations to charts
-
Export or embed charts
Graphy.app use cases
-
Generate a dynamic marketing dashboard pulling live Google Analytics and social media data, automatically highlighting key conversion trends and embedding branded visuals for weekly stakeholder presentations
-
Create an executive finance report that converts quarterly Excel budgets into AI‑annotated bar and line charts, with real‑time updates from accounting APIs and exportable PDFs for board meetings
-
Build a consulting client proposal that transforms raw CSV client data into interactive, auto‑insight charts, brand‑customized and easily embeddable in presentation decks
Who is it for?
-
Data analysts
-
Business intelligence analysts
-
Marketing analysts
-
Financial analysts
-
Decision makers