What is Vizzy?
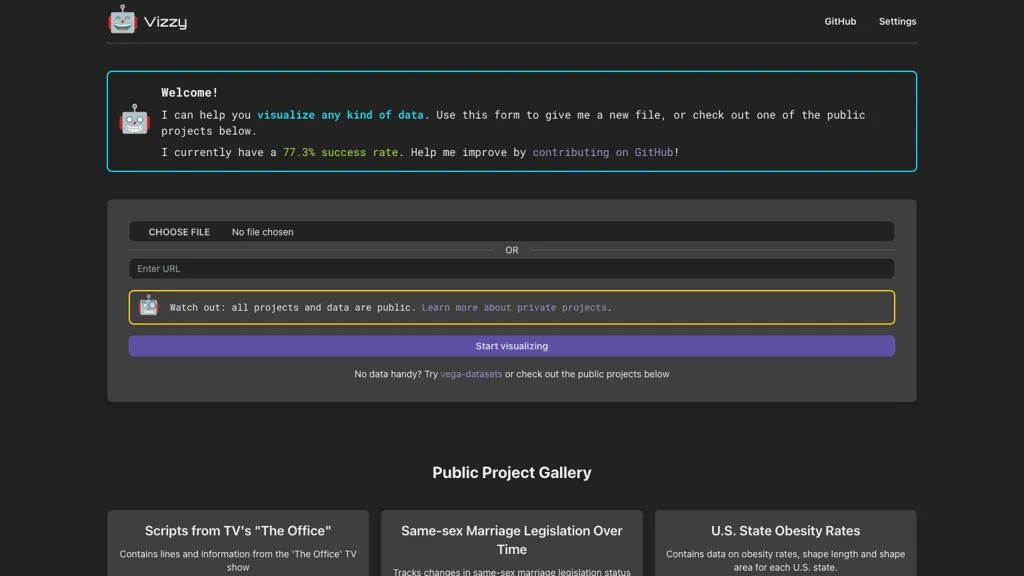
Vizzy is a web‑based platform that leverages large language models to create visualizations from user‑supplied data or from public datasets. Users connect to OpenAI by providing an API token, which is stored only in the browser for privacy and security.
The interface allows file uploads or selection from a gallery that includes projects such as TV‑show scripts, same‑sex marriage legislation timelines, U.S. obesity rates, death‑cause coverage, and national park information. Vizzy processes the data through the LLM and outputs charts and dashboards without requiring coding.
The tool supports private projects with data visibility controls and encourages developers to contribute via GitHub. It includes a simple form for data entry and visualization, and it promotes setting spending limits on the OpenAI account for cost control.
Vizzy pricing Paid
Verify on the official pricing page.
View plansVizzy user reviews
Would you recommend Vizzy?
Vizzy's key features
-
Connects to OpenAI via API token
-
Stores API key locally only
-
Generates visualizations with LLMs
-
Supports custom data file uploads
-
Offers public project gallery
-
Includes Vega dataset examples
Vizzy use cases
-
Turn raw sales data into interactive bar and line charts in the browser with no coding required, letting executives spot revenue spikes instantly
-
Visualize public health datasets on-the-fly, producing publication‑quality plots that auto‑translate captions into multiple languages for global researchers
-
Create private project dashboards with visibility controls, keeping sensitive metrics hidden while still using OpenAI‑powered AI to suggest trend analyses, all stored locally with your API key
Who is it for?
-
Data analysts
-
Academic researchers
-
Policy makers
-
Content creators
-
Product designers