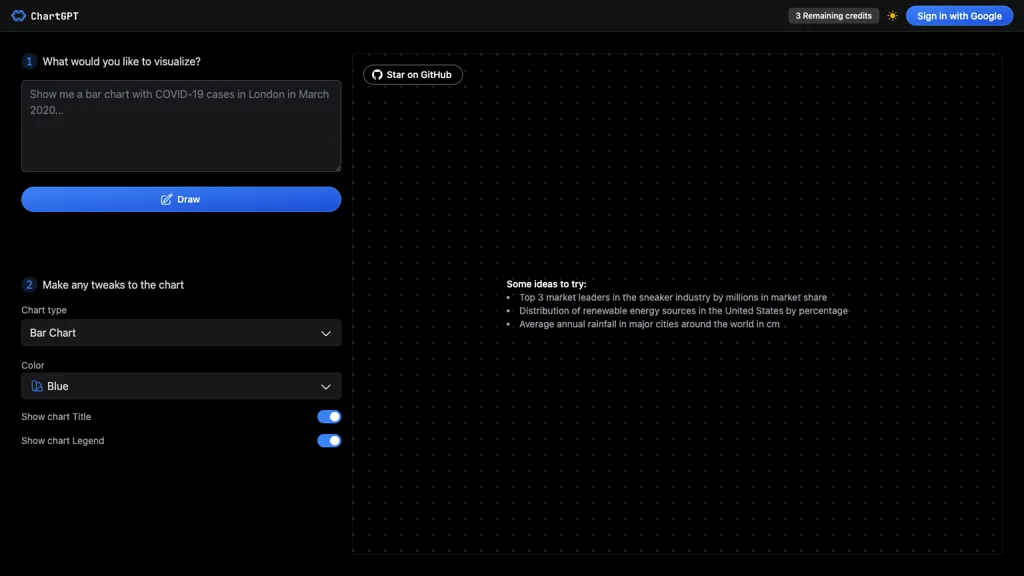
What is ChartGPT?
ChartGPT is an AI tool that allows users to create, customize, and visualize a variety of chart types such as bar charts, area charts, line charts, pie charts, scatter charts, radar charts, radial bar charts, treemaps, and funnel charts. Users can easily make tweaks to the charts by adjusting colors, titles, and legends. It is a useful tool for data visualization and presenting information in a clear and engaging way. Whether you need to display market share distribution, renewable energy sources percentages, or average annual rainfall in major cities worldwide, ChartGPT offers the flexibility and functionality to meet your charting needs. Try it out for your data visualization projects.
ChartGPT user reviews
Based on 1 review, 100.0% of users recommend ChartGPT, rated highly for quality results.
Liked for
Would you recommend ChartGPT?
ChartGPT's key features
-
Create a variety of chart types
-
Customize chart appearance
-
Visualize data effectively
-
Adjust colors, titles, and legends
-
Flexible functionality for diverse data visualization needs
ChartGPT use cases
-
Easily create an informative bar chart showcasing market share distribution for a business presentation with ChartGPT's customizable features and user-friendly interface
-
Visualize renewable energy sources percentages through a visually appealing pie chart using ChartGPT, making complex data easily understandable for stakeholders and clients
-
Generate a detailed radar chart comparing average annual rainfall in major cities worldwide, allowing for a quick and comprehensive analysis of data trends with ChartGPT
Who is it for?
-
Data analysts
-
Project managers
-
Business intelligence specialists
-
Marketing strategists
-
Research scientists