What is Easy Charts?
Easy Charts is a user-friendly tool for creating and customizing data visualizations without subscriptions or downloads.It offers unlimited chart generation and export options in jpg, png, and svg formats.
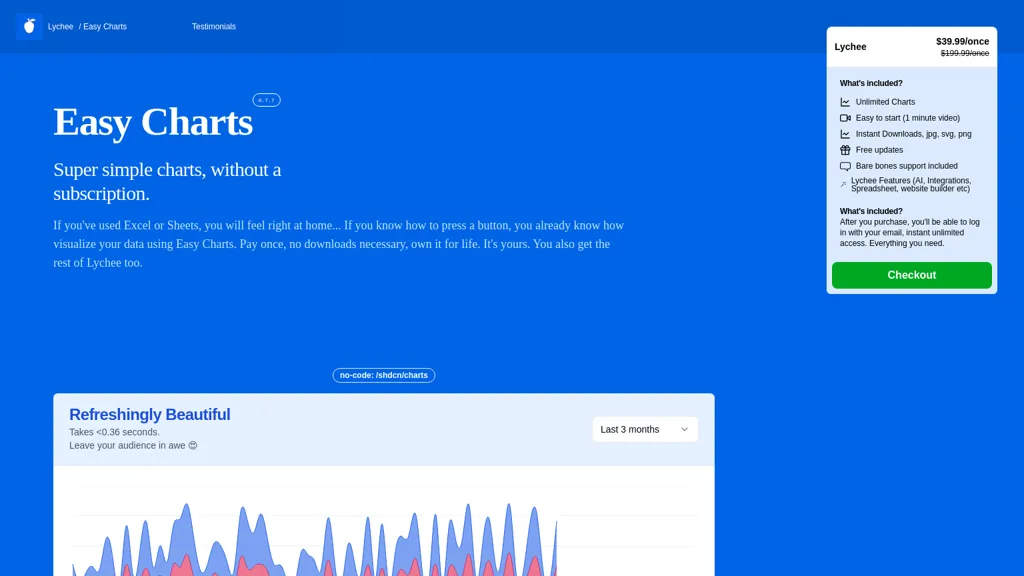
Suitable for users familiar with Excel or Sheets, Easy Charts simplifies the process of making beautiful, professional charts quickly.With no downloads required, users can effortlessly generate unlimited charts and easily export them.
Easy Charts streamlines the charting process in a click of a button.
Easy Charts pricing Paid
One time payment
$39.99/once
Verify on the official pricing page.
View plansEasy Charts user reviews
Based on 4 reviews, 25.0% of users recommend Easy Charts, rated highly for value for money.
1
recommend
3
don't
4 reviews
Liked for
Worth the price
1 of 1
All key features
1 of 1
Disliked for
Inconsistent results
2 of 3
Missing features
2 of 3
Lacks integrations
2 of 3
Not worth the price
1 of 3
Hard to use
1 of 3
Would you recommend Easy Charts?
Recommend this tool?
Easy Charts's key features
-
Generate unlimited charts
-
Export charts in JPG, PNG, and SVG formats
-
Intuitive customization options
-
Easy to use without downloads
Easy Charts use cases
-
Quickly create eye-catching presentations for business meetings with Easy Charts' intuitive interface and a wide range of customization options, saving time and effort in chart design and ensuring a professional look.
-
Effortlessly generate informative charts for academic research papers using Easy Charts, without the need for advanced technical skills, and seamlessly export them in various formats to meet publishing requirements.
-
Empower marketing teams to produce engaging reports and infographics for campaigns with Easy Charts, enabling the visualization of data in a visually appealing manner while maintaining accuracy and clarity.
Who is it for?
-
Data visualizers
-
Product strategists
-
Financial reviewers
-
Marketing professionals
-
Chart enthusiasts