What is CalcGen AI?
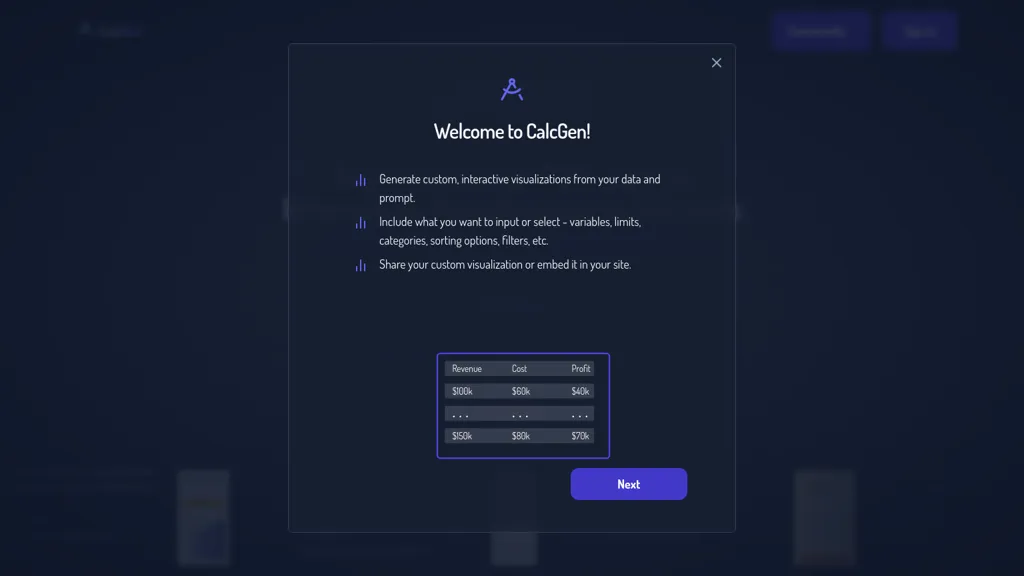
Calcgen AI facilitates the creation of interactive charts, graphs, calculators, and data visualizations in a streamlined manner. Users can generate custom visualizations by selecting input variables, limits, categories, sorting options, and filters, making it suitable for diverse user groups such as financial analysts, scientists, and educators.
Key functionalities include a financial performance graph plotter for analyzing revenue and expenses over multiple quarters, an ideal gas law calculator for solving pressure, and a compound interest calculator for financial advisors. Additionally, Calcgen AI supports community engagement and learning resources to help users transform data into interactive visual content quickly.
CalcGen AI user reviews
Based on 1 review, 100.0% of users recommend CalcGen AI, rated highly for quality results.
Liked for
Would you recommend CalcGen AI?
CalcGen AI's key features
-
Interactive chart and graph creation
-
Custom visualization generation
-
Financial performance graph plotting
-
Ideal gas law calculator
-
Compound interest calculator
CalcGen AI use cases
-
Generate a comprehensive financial performance graph using Calcgen AI to visualize revenue and expenses over multiple quarters, enabling analysts to make informed business decisions
-
Create a user-friendly ideal gas law calculator for teaching students fundamental chemistry concepts, allowing for interactive experimentation with pressure, volume, and temperature relationships
-
Design a custom compound interest calculator for financial advisors to showcase different investment scenarios, helping clients understand potential returns over time with interactive data visualizations
Who is it for?
-
Data analysts
-
Financial analysts
-
Scientific researchers
-
Educators
-
Business professionals