What is Supadash?
Supadash is a dashboard builder that connects to SQL databases such as PostgreSQL, Supabase, and other cloud‑hosted data stores.
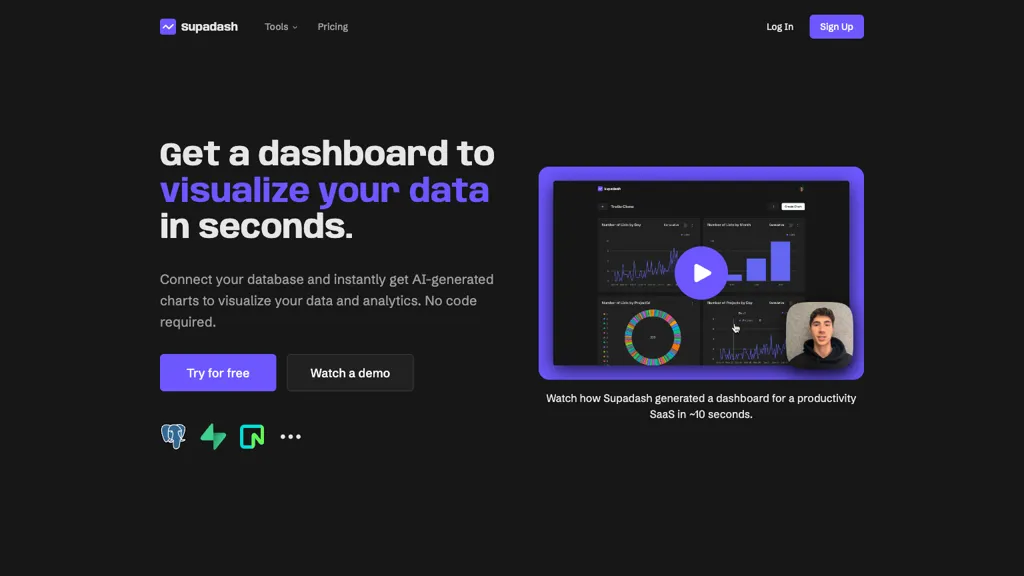
It automatically transforms raw query results into time‑series charts, bar graphs, and other visualizations, removing the need for manual SQL coding or spreadsheet exports.
Developers, data analysts, and founders can import any SELECT statement and instantly view it as a chart, streamlining performance monitoring and KPI tracking across applications.
The interface supports multiple projects with unlimited charts per project, and AI generates an initial layout for the dashboard to accelerate setup.
Supadash pricing Subscription
Basic
$7/mo
Pro
$19/mo
Verify on the official pricing page.
View plansSupadash user reviews
Would you recommend Supadash?
Recommend this tool?
Supadash's key features
-
AI-generated dashboards automatically
-
Zero-code database connection
-
Instant SQL chart generation
-
Automatic time series charts
-
Unlimited project charts
-
Supabase connection string support
Supadash use cases
-
Create a real-time KPI monitoring dashboard for your SaaS product using Supadash, pulling data directly from PostgreSQL and auto-generating time-series charts with AI layouts, all without writing a single line of code
-
Develop a performance monitoring dashboard for DevOps teams with Supadash, visualizing query latency and connection counts from your cloud database using AI-generated layouts and unlimited bar charts, eliminating manual coding
-
Build a dynamic sales reporting dashboard for e-commerce with Supadash, connecting to Supabase to generate unlimited product-category bar charts and time-series revenue charts, while keeping all data private with no user data stored
Who is it for?
-
Data scientists
-
Business strategists
-
Dashboard developers
-
Data visualizers
-
Executive leaders