Csv Visualization
The best 50 Csv Visualization AI tools - Free & Paid
Explore 50 AI for Csv Visualization
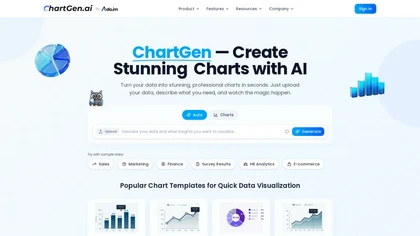
ChartGen.ai is an AI chart generator that converts CSV/Excel data or pasted text into presentation-ready visualizations using plain-English prompts. It supports numerous chart types, offers live data sync, and exports in multiple formats with enterprise-grade security.
Freemium
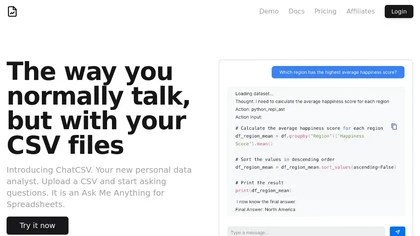
ChatCSV lets users upload CSV files from computer, URL, or clipboard and query data with natural language. It auto‑generates common questions and returns charted answers (bar, pie, custom). Interactions are saved, shareable, used for team collaboration across retail, finance, marketing.
Free
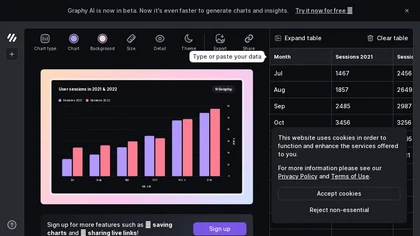
Graphy transforms raw data from Google Sheets, CSV, Excel, or APIs into AI‑generated charts, auto‑highlighting insights. It supports multiple chart types, branding, annotations, real‑time updates, and export/embed options for marketing, finance, and consulting teams.
Freemium
- $16/mo
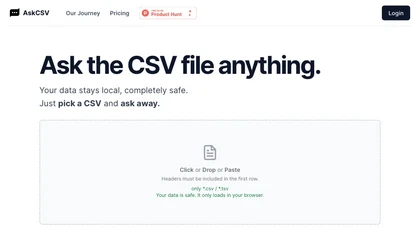
AskCSV lets users upload CSV/TSV files in the browser, query data locally, and receive automatic charts, tables, and insights—such as top products or ROI—while preserving privacy and requiring headers for accurate processing.
Freemium
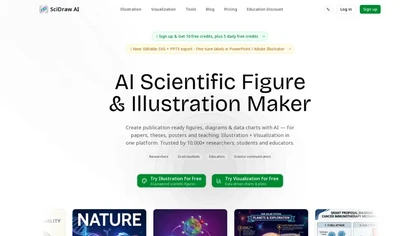
SciDraw AI is a scientific illustration and data visualization tool that converts text prompts, sketches, or images into publication-ready figures. It generates editable SVG/PPTX exports, data-driven charts from CSV/Excel, and supports journal style presets and colorblind-friendly palettes for repro
Free trial
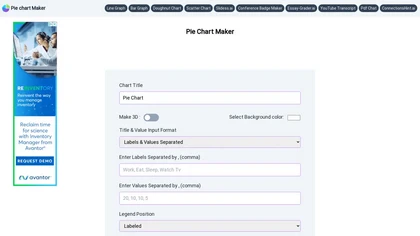
Pie Chart Maker lets users quickly create pie, doughnut, and 3‑D charts by entering comma‑separated labels and values. Adjust colors, legend placement, and rotation; export to PNG, JPEG, or SVG. Ideal for students, teachers, designers.
Free
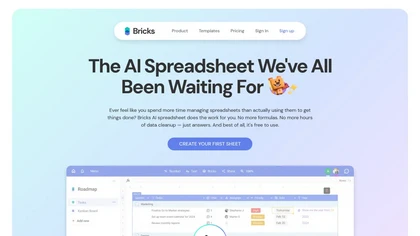
Bricks AI transforms CSV, Excel, Google Sheets, and database files into instant interactive dashboards and reports. It auto‑creates charts, lets users edit data via natural‑language commands, refreshes with one click, and offers reusable templates with encrypted privacy.
Freemium
- $25/mo
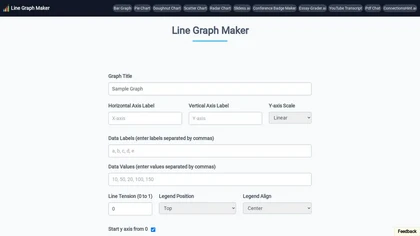
Line Graph Maker lets users input comma‑separated data to produce line charts in PNG, JPG, or SVG. Adjust titles, axis labels, Y‑axis scaling, line tension, legend, grids, colors, and download for reports or presentations.
Free
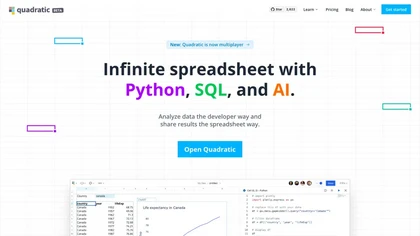
Quadratic is an AI‑enabled spreadsheet that connects to CSV, Excel, PDFs, and databases like Postgres and Snowflake. It lets users filter, clean, and analyze data in a grid, ask natural‑language queries, and generate editable Python and SQL code for visualizations.
Subscription
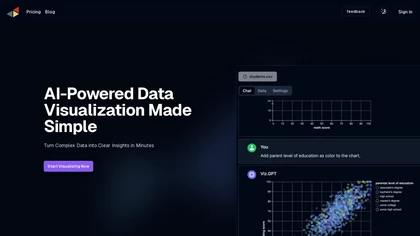
vizGPT turns natural‑language queries and drag‑and‑drop into live dashboards and charts, retaining context for follow‑ups. It includes data tables for profiling and transforms, and design tools that generate Lottie JSON and SVG animations, enabling team collaboration.
Paid
- $10/mo
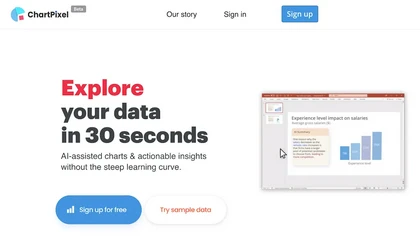
ChartPixel is an AI tool that generates charts and insights from messy data files or webpages using AI algorithms to clean and engineer new features, provide AI-assisted annotations and statistics to explore patterns and quirks in the data.
Freemium
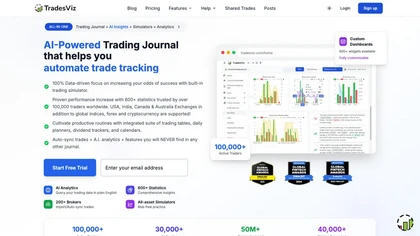

DropCSV automatically cleans and validates CSV/TSV/Excel uploads, applies AI to detect patterns, anomalies and generate natural-language explanations, builds interactive charts, dashboards and forecasts, exports reports and integrates with APIs and team workflows.
Free trial
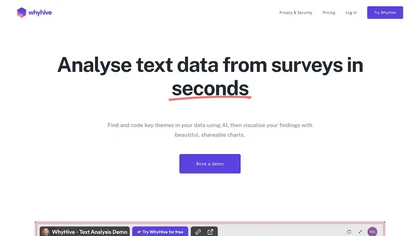
WhyHive transforms CSV/Excel data into visual insights, automatically extracting themes from open‑ended text, tallying occurrences, and generating rule‑based charts. It combines GPT summarisation with data‑faithful charting, enabling rapid dashboards for research, marketing, and impact evaluation.
Freemium
- $29/mo

ChartGPT is an AI tool that facilitates easy creation and customization of multiple chart types for enhanced data visualization. It provides versatility in displaying data through various charts, ensuring clear and captivating presentations for diverse projects.
Freemium

ChartFast uses GPT‑4o to clean, normalize, and analyze datasets, then instantly generates customizable charts via natural‑language queries. Exportable to CSV/Excel, it supports Python scripts for large‑scale analysis, streamlining workflows for analysts and non‑technical users.
Subscription
- $9/mo

PlotsAlot provides AI-assisted data analysis and visualization, turning CSV/Excel/SPSS/JSON/PDF/image uploads into interactive charts and full-stack dashboards via natural-language queries. Features include conversational data chat, predictive analytics, automated reporting, and reusable dashboards.
Free
- $10/mo
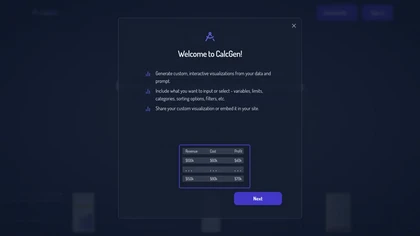
Calcgen AI enables users to create custom interactive charts, graphs, and calculators for data visualization. It includes tools for financial analysis, scientific calculations, and educational purposes, catering to a broad range of professional needs.
Subscription
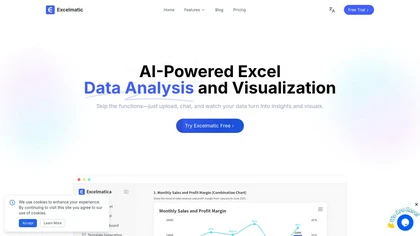
Excelmatic uses AI to analyze and visualize spreadsheet data via natural-language queries, offering one-click charting, KPI extraction, anomaly detection, PDF/image-to-Excel conversion, formula generation from plain English, and batch data-prep for .xlsx/.csv files.
Subscription


Kasipa converts CSV, Excel, and Google Sheets into interactive charts, tables, and statistical summaries using AI-driven natural-language queries. Runs entirely in-browser without sign-up, enabling rapid exploratory visualization, reporting, and dataset exploration with templates and examples.
- $15/mo
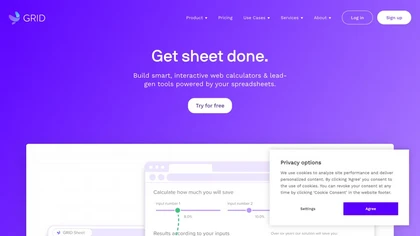
GRID embeds a native spreadsheet engine in apps for real‑time calculation and data management. With optional editor/viewer UI, it supports AI/LLM integration, improves reliability, scales workflows, streamlines development, and offers a familiar spreadsheet experience.
Free
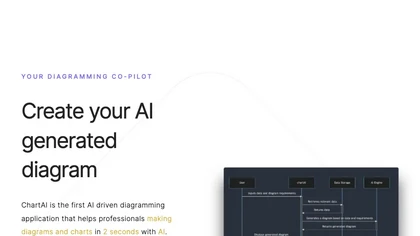
ChartAI auto‑creates diverse visualizations—mind maps, flowcharts, timelines, Gantt charts, ER diagrams, etc.—by converting data into polished diagrams. It offers templates, quick start, and dataset generation, aiding analysts, researchers, educators, and managers.
Free
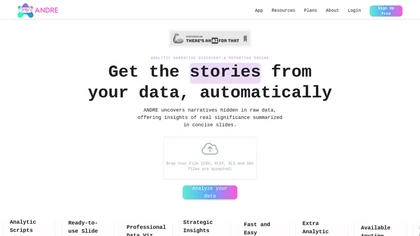
ANDRE converts survey files (CSV, XLSX, SPSS, Google Forms, Typeform) into clean, visual reports in under 15 minutes, automating data cleaning, missing‑value imputation, narrative analysis, and producing a single‑slide insights deck for rapid decision‑making.
Freemium
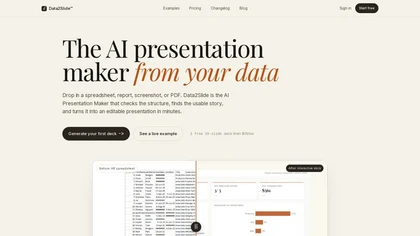
data2slide.com is a browser-based AI presentation maker that transforms CSVs, Excel files, PDFs, and text briefs into fully editable slide decks. It automatically checks data quality, detects chartable KPIs, and generates structured presentations with charts, tables, and summaries for export to HTML
Free trial
- $15/mo

Piktochart is an AI‑powered visual creation platform that turns text into infographics, charts, and videos within seconds. It offers templates, a brand kit, collaborative editing, interactive graphics, and export options for print and digital use.
Freemium

Julius AI is a data analyst assistant that connects to Excel, Google Sheets, and PostgreSQL to generate bar charts, histograms, heat maps automatically. It offers interactive, customizable visualizations, embeddable into reports, and exports cleaned data for stakeholders.
Freemium
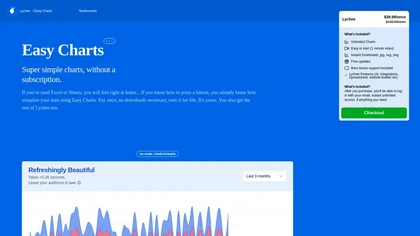
Easy Charts is an AI-powered tool for data visualizations and charts generation without the need for downloads. It offers unlimited chart generation, easy exports, and customization options, making charting effortless for all user levels.
Paid
- $39.99
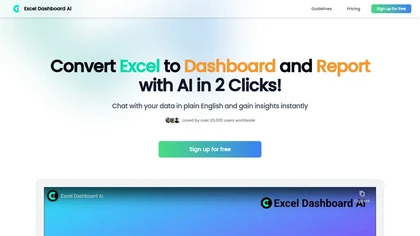
ExcelDashboard AI transforms Excel data into interactive dashboards and reports with minimal effort. Users can generate insights using plain English, automate visualizations, and customize analyses, making it suitable for both beginners and experienced data analysts.
Free trial

InfographAI converts text, URLs, PDFs, Word docs, and spreadsheets into AI-generated infographics. It extracts key points, auto-places charts and visuals, offers customizable templates and a drag-and-drop editor, and exports PNG or PDF for reports and social media.
Freemium
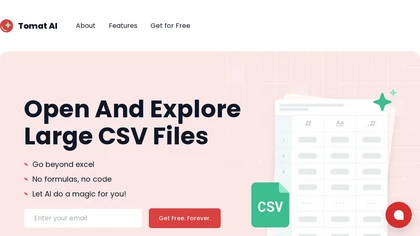
Tomat.AI is a desktop app that automates data analysis and enrichment for Excel, CSV, and database files. It loads datasets locally, lets users filter, sort, merge, pivot, and apply AI prompts in bulk, and exports reports to PDF.
Subscription
- $7/mo

Plainly automates video production by converting After Effects templates into multiple variants using CSV or API data, supporting versioning, localization, and dynamic content. It renders securely in the cloud, enabling rapid, scalable, multi‑platform output.
Subscription
- $69/mo

Converts text, images, PDFs and spreadsheets into editable diagrams—flowcharts, decision trees, UML, mindmaps, org charts and Gantt—by parsing processes into steps, decisions and loops, offering auto-layout, collaborative editing and PNG/SVG/PDF export.
Free trial
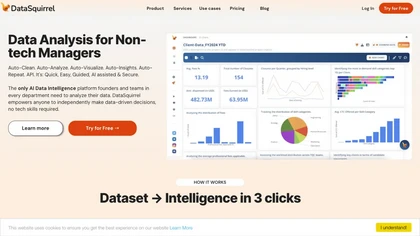
DataSquirrel.ai automates data cleaning, analysis, and visualization for business users, enabling quick chart creation, KPI dashboards, and custom reports without coding. It supports scheduled refreshes, GDPR compliance, and interactive sharing for teams and consultants.
Paid
- $15

Ctrl Sheet is an AI tool that enhances spreadsheet management by automating data analysis, model building, and visualization. It integrates with Google Sheets and Excel, streamlining workflows for financial analysts and project managers.
Subscription
Julius AI connects spreadsheets, databases, and cloud storage, letting users ask natural‑language questions. It delivers instant charts, tables, and reports, sharable in Slack or on a schedule, and supports no‑code plus R, Python, or SQL workflows, keeps data private.
Free
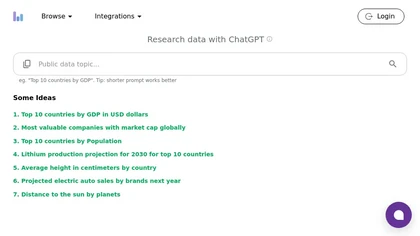
Columns.ai is a data visual storytelling AI tool for creating appealing data visual stories. It uses ChatGPT to generate insightful responses to data-related prompts and offers customization options for interactive visualizations.
Freemium
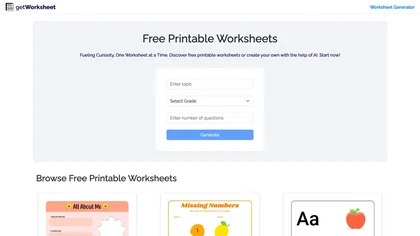
Worksheet Generator lets teachers create custom math, English, science, or social studies worksheets in seconds, setting grade level, question type, and difficulty. It supports PDF export and cloud storage for easy access from any device.
Freemium
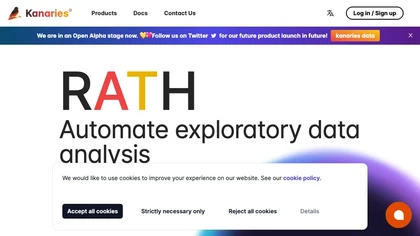
Kanaries transforms raw data into interactive visual insights with AI‑assisted code completion for Pandas, RStudio, and Jupyter. Drag‑and‑drop chart building, natural‑language chat, real‑time collaboration, and offline desktop support streamline the entire exploration workflow across web and desktop
Subscription
Datayaki lets users ask plain‑English questions of spreadsheets, CSVs, and cloud databases (Postgres, Supabase, Snowflake, Firebase) directly in the browser. It keeps data local, offers explainable AI, and supports secure, collaborative dashboards.
Freemium
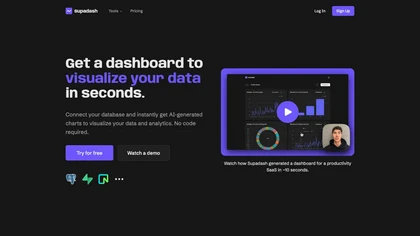
Supadash lets users connect to SQL databases like PostgreSQL or Supabase and automatically turns SELECT results into time‑series and bar charts without manual coding. It supports unlimited charts per project, offers AI‑generated layouts, and stores no user data.
Subscription
- $7/mo
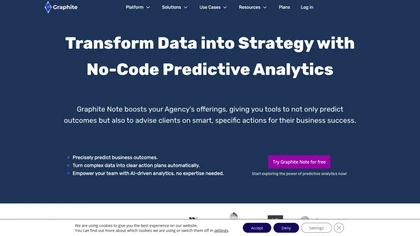
Graphite Note is a user-friendly, no-code predictive analytics tool for cross-industry teams. It delivers accurate predictions (outcomes, lead conversions), analyzes customer behavior, creates personalized marketing strategies, optimizes campaigns, and forecasts demand, simplifying complex data ana
Paid

AI Infographic Generator converts text and data into customizable graphics like infographics and flowcharts. With over 500 templates and multi-language support, it enables editing and downloading in multiple formats, all while supporting 4K resolution.
Freemium
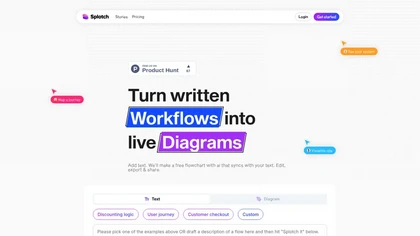
Splotch is a free AI flowchart generator that converts textual workflows into interactive diagrams, facilitating easy visualization, collaboration, and communication for teams in various fields, including product management, marketing, and e-commerce.
Free trial
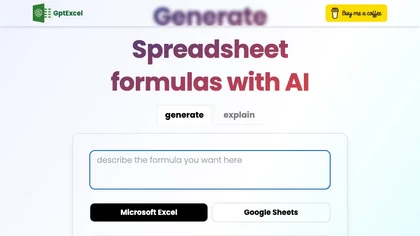
GPTExcel automates spreadsheet tasks in Excel, Google Sheets, LibreOffice, and Airtable. It generates formulas, scripts, SQL, regex, builds pivot tables, charts, and reports, offers conversational data queries, and OCR table conversion across 50+ languages.
Freemium

Datarails integrates with Excel, automating data consolidation from 200+ accounting, ERP, CRM, bank, and HRIS sources. It offers real‑time dashboards, AI‑driven variance insights, scenario modeling, and collaborative version control for efficient month‑end close and planning.
Freemium
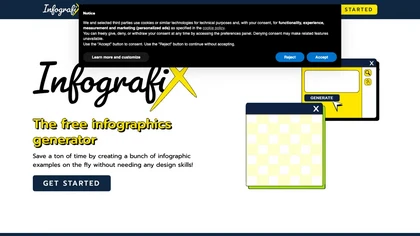
Infografix leverages Azure AI to turn text prompts into infographics—timelines, mind maps, SWOT analyses, family trees, and more—using templates, over 1,500 Google Fonts, and direct canvas editing. Export to PNG, JPG, SVG, PDF and share on social media.
Free
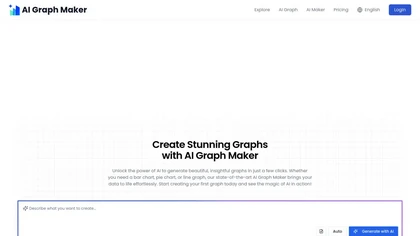
Free AI Graph Maker enables users to create interactive charts and graphs, including bar, pie, and line charts. It supports Gantt charts, flowcharts, and mind maps, facilitating effective data visualization for various sectors like education and finance.
Freemium