What is Datasquirrel.ai?
DataSquirrel.ai provides automated data cleaning, analysis, visualization, and insight generation for non‑technical business users.
Users can upload CSV, Excel, Google Sheets, or connect via API, and the platform auto‑cleans inconsistencies, merges multiple tabs, and normalizes currency and format errors.
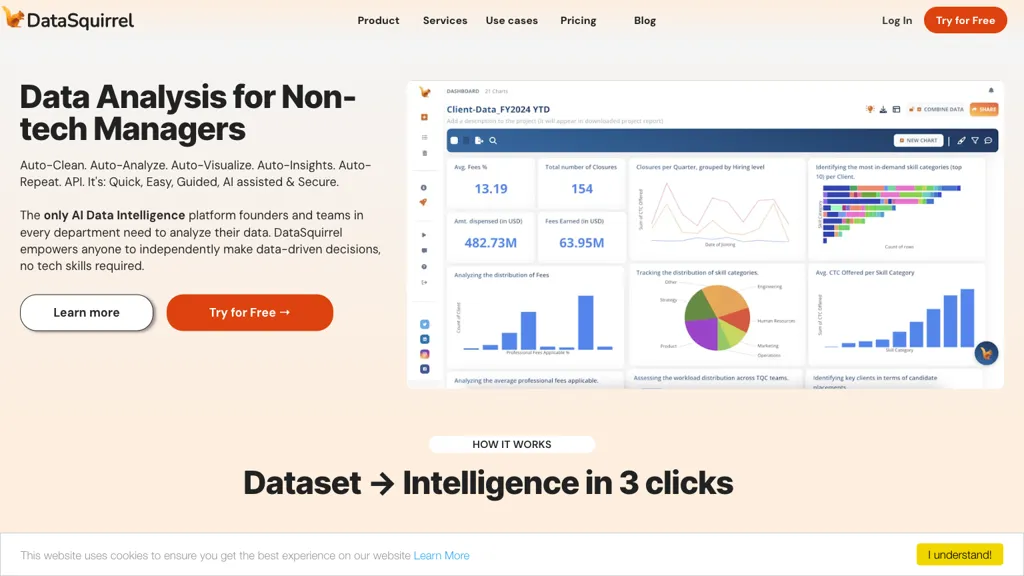
The AI engine produces charts, heat‑maps, pivot tables, and KPI dashboards within three clicks, enabling instant storytelling without formulas or coding.
Custom reports can be tailored for managers, teams, or consultants, then shared as interactive dashboards, PDFs, or embedded links with comment and annotation features.
Automated workflows schedule data refreshes daily, weekly, monthly, or yearly, keeping reports current and saving repetitive effort.
The web‑based interface complies with GDPR and PDPA, anonymizes data by default, and never forwards raw data to external language models.
The tool supports root‑cause analysis, quick RCA, and on‑demand analysis for fast decision making across departments.
Integration of a single‑click “Explore & Play” panel allows users to apply date grouping, filtering, theming, and segmentation without technical setup.
DataSquirrel.ai replaces manual pivot tables, vLOOKUP, and SQL queries with a self‑service AI workflow that keeps analysts focused on insight generation.
It is suitable for managers, collaborative teams, and consulting engagements that require rapid, repeatable, and secure data reporting.
Datasquirrel.ai pricing Paid
Verify on the official pricing page.
View plansDatasquirrel.ai user reviews
Would you recommend Datasquirrel.ai?
Datasquirrel.ai's key features
-
Automated 1‑click data analysis
-
Instant Go Auto graph generation
-
Automated data cleaning & standardization
-
Automatic data categorization
-
Customizable chart themes
-
Drag‑and‑drop CSV/Excel import
-
Collaborative commenting & sharing
Datasquirrel.ai use cases
-
Generate weekly sales KPI dashboards for remote sales teams, automatically refreshing data every midnight and sharing interactive visuals via secure links
-
Create compliance‑ready GDPR audit reports for a fintech client, leveraging automated data cleaning and scheduled refreshes to keep data up‑to‑date
-
Develop root‑cause analysis visualizations for customer churn, enabling non‑technical managers to spot trends and drill down into key drivers without writing code
Who is it for?
-
Data analysts
-
Business managers
-
Strategic planners
-
Dashboard viewers
-
Visual learners