What is kasipa?
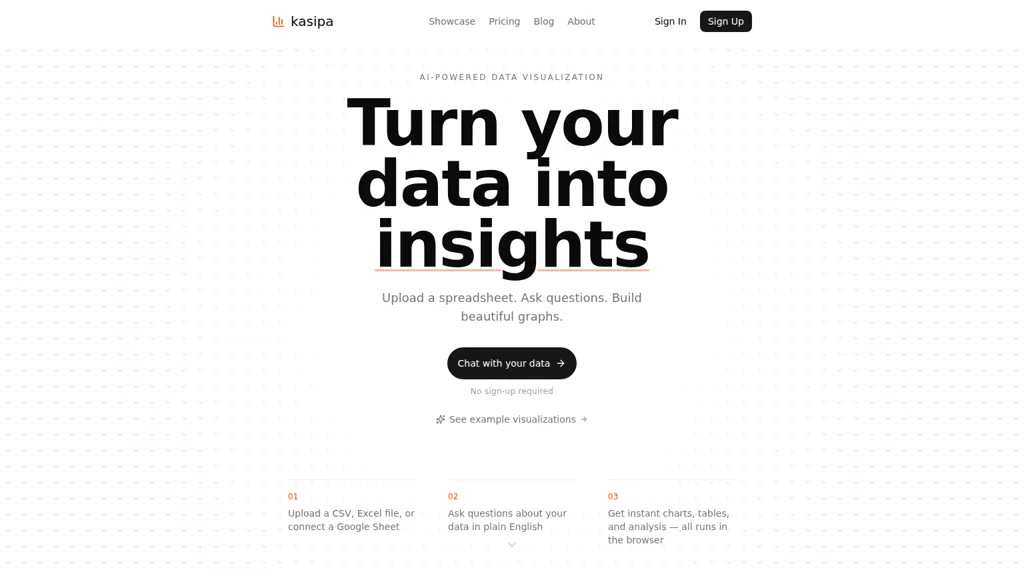
kasipa converts CSV, Excel, and Google Sheets into charts and tables using AI-driven data visualization.
Upload or connect spreadsheets and use natural-language queries to generate instant charts, tables, and statistical summaries in the browser.
Supports CSV-to-chart and Excel-to-chart workflows and produces interactive visualizations for analysis and reporting.
Runs entirely in-browser without sign-up, enabling fast dataset exploration on desktop devices.
Designed for data analysts, business users, product managers, researchers, and students who need quick spreadsheet visualization and exploratory analysis.
kasipa pricing
Personal
$0
Professional
$15/mo
Enterprise
custom
Verify on the official pricing page.
View planskasipa user reviews
Would you recommend kasipa?
Recommend this tool?
kasipa's key features
-
Upload CSV, Excel, or connect Google Sheets
-
Ask questions about your data in plain English
-
Generate instant charts, tables, and analysis
-
Interactive chat interface to query and explore data
-
Runs entirely in the browser
kasipa use cases
-
Create interactive, shareable dashboards from CSV, Excel, or Google Sheets using Kasipa without any coding knowledge or sign-up, converting raw spreadsheets into charts, tables and statistical summaries for presentations and stakeholder updates
-
Rapidly explore and analyze survey, sales, or product datasets with Kasipa's AI natural-language queries to generate visualizations, surface trends and outliers, and export ready-to-use charts for reports
-
Perform fast data QA and ad-hoc reporting in-browser by converting spreadsheets to interactive spreadsheet charts and statistical summaries with Kasipa's templates and examples, enabling quick iteration and collaborative dataset exploration
Who is it for?
-
Report creators
-
Business leaders
-
Data analysts
-
Student learners
-
Data explorers