Python Visualization
The best 50 Python Visualization AI tools - Free & Paid
Explore 50 AI for Python Visualization
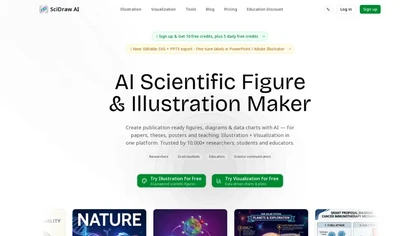
SciDraw AI is a scientific illustration and data visualization tool that converts text prompts, sketches, or images into publication-ready figures. It generates editable SVG/PPTX exports, data-driven charts from CSV/Excel, and supports journal style presets and colorblind-friendly palettes for repro
Free trial
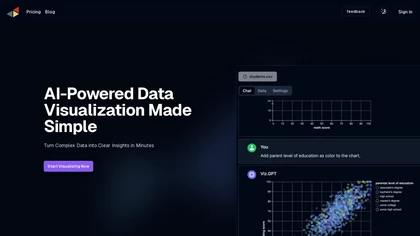
vizGPT turns natural‑language queries and drag‑and‑drop into live dashboards and charts, retaining context for follow‑ups. It includes data tables for profiling and transforms, and design tools that generate Lottie JSON and SVG animations, enabling team collaboration.
Paid
- $10/mo
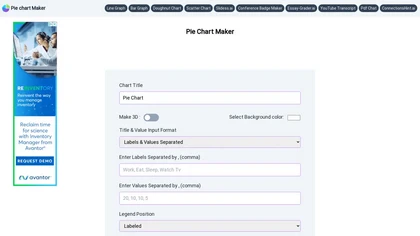
Pie Chart Maker lets users quickly create pie, doughnut, and 3‑D charts by entering comma‑separated labels and values. Adjust colors, legend placement, and rotation; export to PNG, JPEG, or SVG. Ideal for students, teachers, designers.
Free
Kanaries transforms raw data into interactive visual insights with AI‑assisted code completion for Pandas, RStudio, and Jupyter. Drag‑and‑drop chart building, natural‑language chat, real‑time collaboration, and offline desktop support streamline the entire exploration workflow across web and desktop
Subscription

paper-banana.ai is an AI tool that automates the creation of publication-ready scientific figures from text and data. It generates accurate, reproducible diagrams and plots with downloadable code, formatted for academic papers and presentations.
Subscription
- $6.99/mo

Paper Banana is an AI tool that generates publication-ready academic illustrations from text and sketches. It produces accurate scientific diagrams, statistical charts with executable Python code, and editable assets for papers and presentations.
Subscription
- $13.5/mo
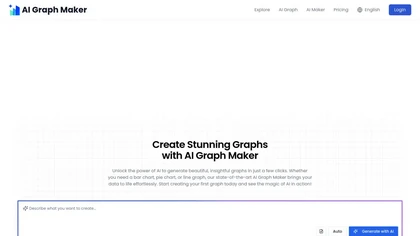
Free AI Graph Maker enables users to create interactive charts and graphs, including bar, pie, and line charts. It supports Gantt charts, flowcharts, and mind maps, facilitating effective data visualization for various sectors like education and finance.
Freemium
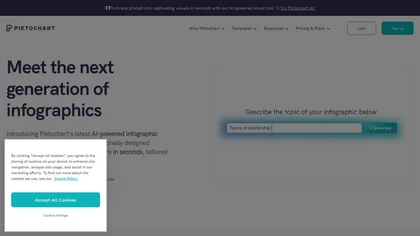
Piktochart is an AI‑powered visual creation platform that turns text into infographics, charts, and videos within seconds. It offers templates, a brand kit, collaborative editing, interactive graphics, and export options for print and digital use.
Freemium
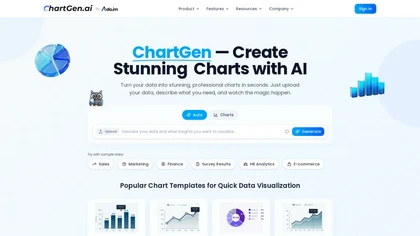
ChartGen.ai is an AI chart generator that converts CSV/Excel data or pasted text into presentation-ready visualizations using plain-English prompts. It supports numerous chart types, offers live data sync, and exports in multiple formats with enterprise-grade security.
Freemium
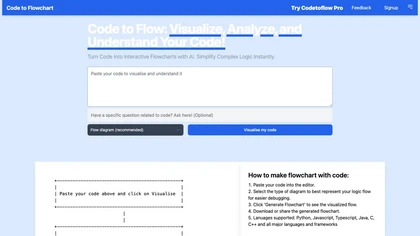
Code to Flowchart converts source code into interactive flowcharts, sequence, and class diagrams for Python, JavaScript, Java, C++, and TypeScript. It visualizes logic paths, loops, and conditionals, supports export to SVG/PNG/PDF, and prioritizes privacy with no code storage.
Subscription
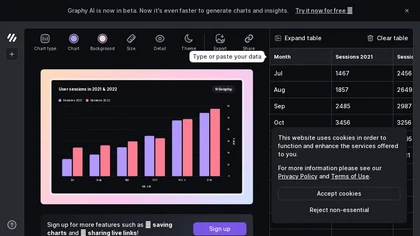
Graphy transforms raw data from Google Sheets, CSV, Excel, or APIs into AI‑generated charts, auto‑highlighting insights. It supports multiple chart types, branding, annotations, real‑time updates, and export/embed options for marketing, finance, and consulting teams.
Freemium
- $16/mo

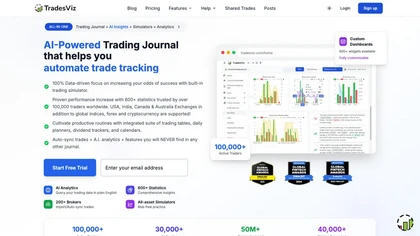

Julius AI is a data analyst assistant that connects to Excel, Google Sheets, and PostgreSQL to generate bar charts, histograms, heat maps automatically. It offers interactive, customizable visualizations, embeddable into reports, and exports cleaned data for stakeholders.
Freemium
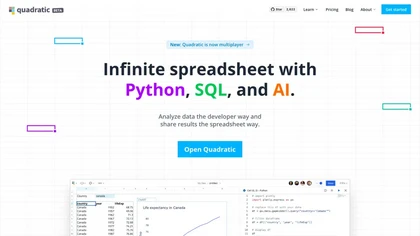
Quadratic is an AI‑enabled spreadsheet that connects to CSV, Excel, PDFs, and databases like Postgres and Snowflake. It lets users filter, clean, and analyze data in a grid, ask natural‑language queries, and generate editable Python and SQL code for visualizations.
Subscription
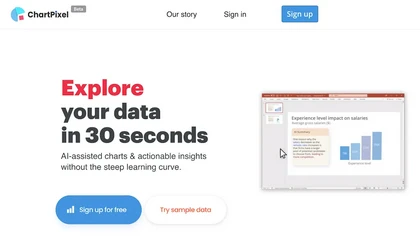
ChartPixel is an AI tool that generates charts and insights from messy data files or webpages using AI algorithms to clean and engineer new features, provide AI-assisted annotations and statistics to explore patterns and quirks in the data.
Freemium

Tableau AI is an intelligent analytics platform that combines AI technologies for enhanced data exploration and decision-making. It offers scalable solutions, trusted by organizations, to boost data-driven insights and promote innovative cultures.
Free trial
- $15
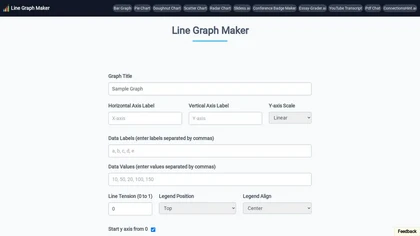
Line Graph Maker lets users input comma‑separated data to produce line charts in PNG, JPG, or SVG. Adjust titles, axis labels, Y‑axis scaling, line tension, legend, grids, colors, and download for reports or presentations.
Free
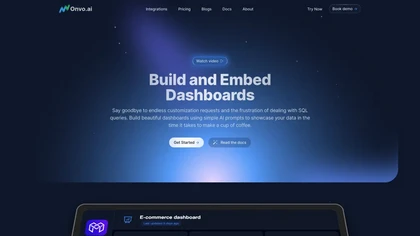
Onvo AI revolutionizes data visualization through AI prompts, enabling users to easily generate tailored charts and dashboards without intricate queries. It ensures secure sharing, supports multiple data source integrations, and provides SDKs for smooth product incorporation.
Free trial
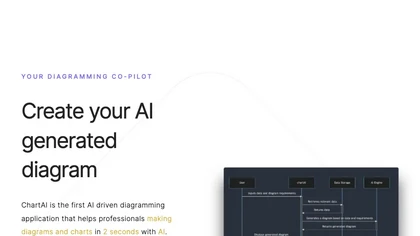
ChartAI auto‑creates diverse visualizations—mind maps, flowcharts, timelines, Gantt charts, ER diagrams, etc.—by converting data into polished diagrams. It offers templates, quick start, and dataset generation, aiding analysts, researchers, educators, and managers.
Free
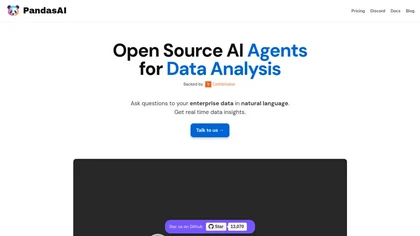
PandasAI is an open-source tool for conversational data analysis that allows users to query data in natural language. It integrates various data sources, provides real-time insights, and generates detailed reports and visualizations for effective decision-making.
Subscription

Visualizee.ai turns plain‑language descriptions into photorealistic 2K/4K renders and motion videos for architects, designers, and developers. Its conversational AI, multi‑language support, and context‑aware geometry enable quick lighting, material, and batch image transformations.
Freemium
- $15/mo

VisualizeAI transforms sketches, photos, or images into high‑quality renders within seconds. Users choose style, color, and theme from over 100 presets or custom options, supporting architecture, interior, product design, and hobby projects for rapid ideation.
Subscription
- $17/mo

Paper Banana generates publication-ready academic illustrations and scientific figures from text or image inputs, offering T2I/I2I workflows, an integrated editor for iterative edits, multiple diagram styles, high-resolution output (up to 2048px), and pipeline-based fidelity improvements.
Freemium
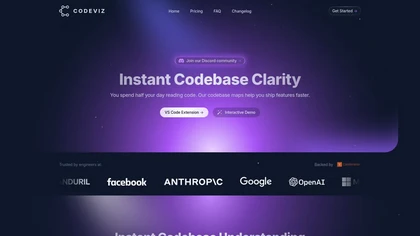
CodeViz automatically scans codebases in major languages to generate editable, versioned architecture diagrams. Teams view end‑to‑end workflows, API routes, and data flows, embed them in Git, Jira, Slack, or Figma, and sync branch‑specific designs for faster reviews and deployments.
Freemium
- $19/mo
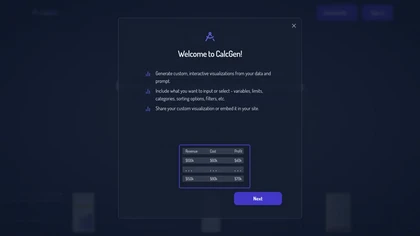
Calcgen AI enables users to create custom interactive charts, graphs, and calculators for data visualization. It includes tools for financial analysis, scientific calculations, and educational purposes, catering to a broad range of professional needs.
Subscription
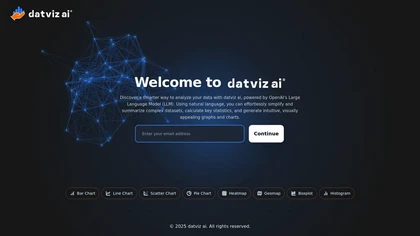
Datviz AI is a data visualization tool that leverages OpenAI's language model to analyze complex datasets and generate insightful charts. It offers an intuitive interface for creating diverse visualizations like bar charts, heatmaps, and geomaps to support data-driven decisions.
Freemium

VisualGPT is an AI image generator and editor, offering features like background removal, photo retouching, and interior design visualization. It supports models such as Nano Banana and Flux, facilitating bulk processing and social media content creation.
Free trial
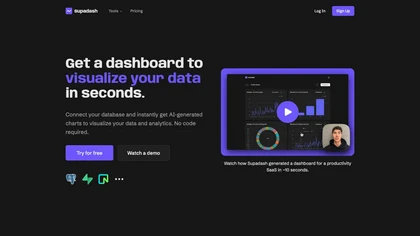
Supadash lets users connect to SQL databases like PostgreSQL or Supabase and automatically turns SELECT results into time‑series and bar charts without manual coding. It supports unlimited charts per project, offers AI‑generated layouts, and stores no user data.
Subscription
- $7/mo
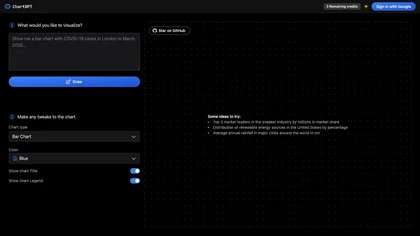
ChartGPT is an AI tool that facilitates easy creation and customization of multiple chart types for enhanced data visualization. It provides versatility in displaying data through various charts, ensuring clear and captivating presentations for diverse projects.
Freemium
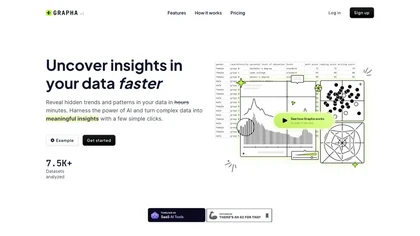
Grapha.ai is an AI-enabled data exploration tool that swiftly reveals hidden trends and provides intuitive visualizations & insights from complex datasets without requiring any coding knowledge.
Subscription
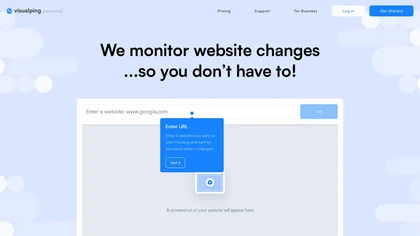
Visualping monitors website changes—visual, textual, or code—in real time, sending alerts via email, Teams, Slack, webhooks, or API. It provides before‑and‑after screenshots, AI‑highlighted significant changes, and easy browser integration for individuals and teams.
Freemium
- $10/mo

PlotsAlot provides AI-assisted data analysis and visualization, turning CSV/Excel/SPSS/JSON/PDF/image uploads into interactive charts and full-stack dashboards via natural-language queries. Features include conversational data chat, predictive analytics, automated reporting, and reusable dashboards.
Free
- $10/mo
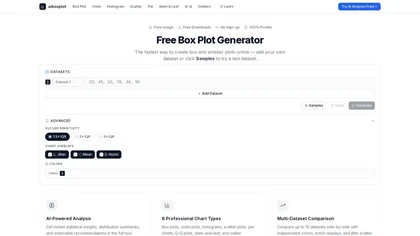
aiboxplot is a free, browser-based AI chart generator that creates box plots, violin plots, histograms, scatter plots, and more from pasted or uploaded data. It computes five-number summaries, flags outliers with adjustable Tukey fences, compares up to 10 datasets, and offers one-click PNG/SVG/CSV
Free

OpenPencil.dev is a lightweight, open-source desktop design editor that runs locally with full Figma file support. It offers scriptable workflows and an optional AI chat tool, prioritizing developer control and extensibility under the MIT license.
Free

MermaidViewer is a browser-based Mermaid diagram editor with live preview, supporting a wide range of chart types. It features AI-assisted code generation, real-time collaboration, and export options for team documentation workflows.
Free trial
- $69.99
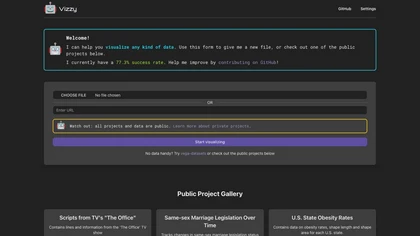
Vizzy turns user data or public datasets into charts and dashboards using large language models. It runs entirely in the browser, stores the OpenAI API key locally, and supports private projects with visibility controls—no coding required.
Paid



Wizart provides AI-driven product visualization for manufacturers and retailers, generating photorealistic renders, interactive configurators, and SEO-ready assets; Vision and Visualizer APIs enable surface segmentation, room geometry, white-label visualizers, and easy platform integrations.
Free trial

Home Visualizer AI converts photos, sketches, and elevations into photorealistic home renderings. It automatically selects styles, fuses inspirations, and refines low‑fidelity renders, enabling designers and homeowners to preview remodels quickly and securely.
Subscription
- $12/mo
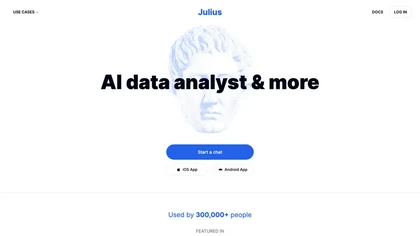
Julius AI connects spreadsheets, databases, and cloud storage, letting users ask natural‑language questions. It delivers instant charts, tables, and reports, sharable in Slack or on a schedule, and supports no‑code plus R, Python, or SQL workflows, keeps data private.
Free

ChartFast uses GPT‑4o to clean, normalize, and analyze datasets, then instantly generates customizable charts via natural‑language queries. Exportable to CSV/Excel, it supports Python scripts for large‑scale analysis, streamlining workflows for analysts and non‑technical users.
Subscription
- $9/mo
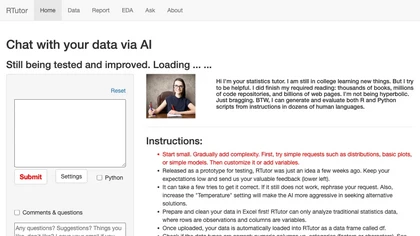
RTutor converts natural‑language prompts into R or Python code for exploratory data analysis. Upload CSV/TSV/Excel, auto‑load into df/df2, generate statistics, plots, and an interactive HTML report, with session context and data privacy.
Subscription


tensor.art is an AI art platform that enforces real-time human verification and connection reviews (Cloudflare-backed) to block automated access, requiring JavaScript-enabled browsers and offering verification status and access-control integrations for developer workflows and APIs.
Freemium