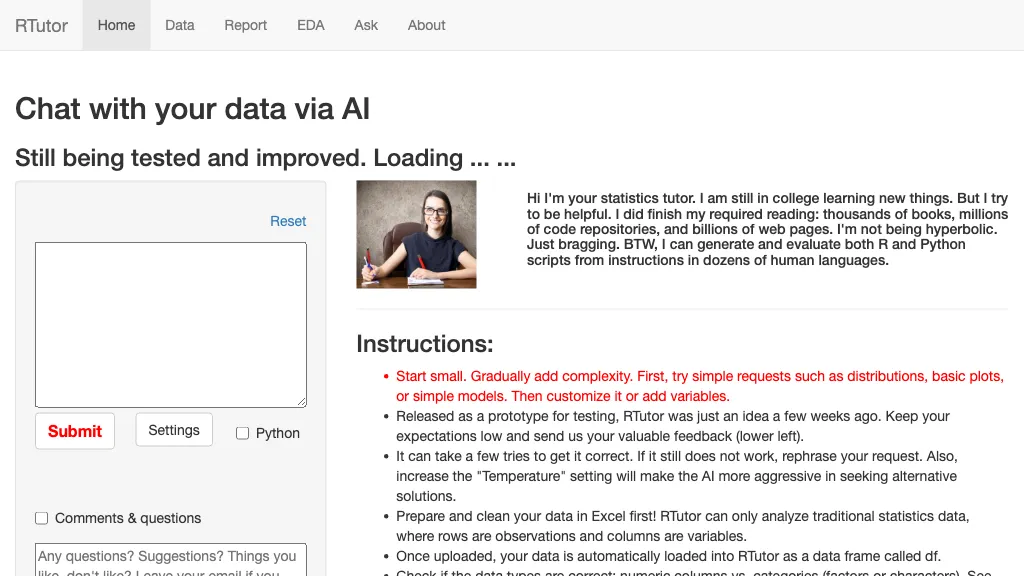
What is RTutor?
RTutor converts natural language requests into executable R or Python scripts for exploratory data analysis. The web interface lets users upload CSV, TSV, or Excel files that are automatically loaded into an R data frame named df, and a second file can be referenced as df2.
After uploading, the system generates descriptive statistics, correlation matrices, pair plots, histograms, Q‑Q plots, and summary tables using packages such as DataExplorer, summarytools, and GGally, and offers interactive visualizations with Plotly or CanvasXpress.
Users can refine the output by issuing new prompts that modify existing plots or code, and the tool retains session context so subsequent requests build on prior results. Generated code can be downloaded as an HTML report within minutes and is available for review or further editing.
The platform is intended for students, researchers, and analysts in educational or non‑profit settings and respects data privacy by discarding uploads after the session. The default model is GPT‑4o, with options to switch to a custom API key or to use Python instead of R.
RTutor user reviews
Would you recommend RTutor?
RTutor's key features
-
Upload CSV/Excel data
-
Translate natural language to code
-
Generate exploratory data analysis
-
Interactive Plotly and CanvasXpress plots
-
Analyze multiple data frames
-
Download HTML report
-
Prompt-based Q&A interface
RTutor use cases
-
Easily generate comprehensive descriptive statistics and interactive plots for a marketing campaign dataset by simply asking RTutor in natural language, eliminating the need for manual coding or advanced statistical knowledge
-
Transform raw customer feedback data into insightful Python scripts and visualizations with RTutor's prompt‑to‑code engine, enabling data scientists to prototype sentiment analysis models faster than writing boilerplate code
-
Assist university students in exploring economics datasets by uploading CSV files and using conversational prompts to create R data frames, summaries, and Plotly charts for their research projects without writing a single line of code
Who is it for?
-
Data scientists
-
Research scientists
-
Nonprofit leaders
-
Software developers
-
Voice recognition engineers