
What is aiboxplot?
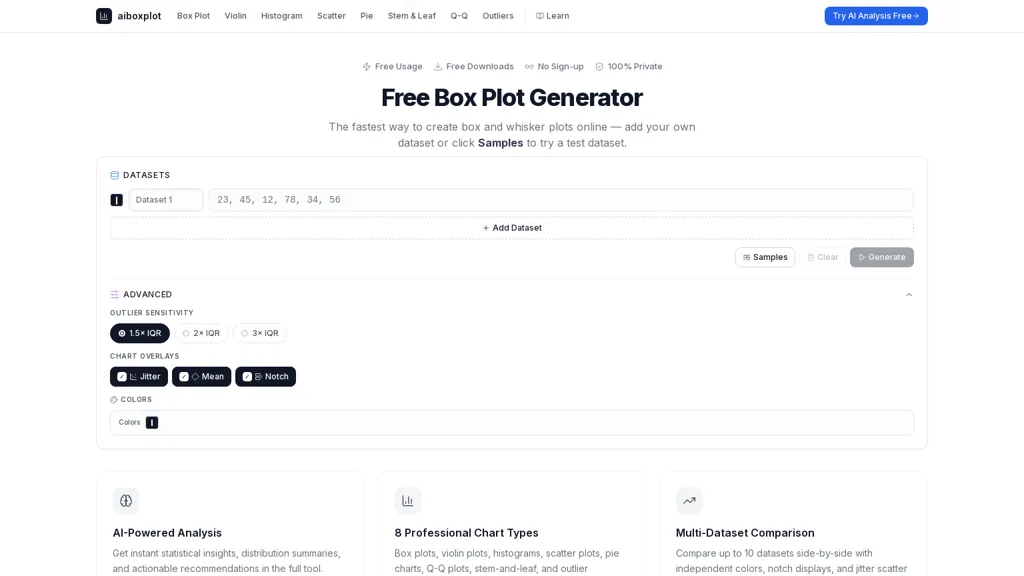
aiboxplot creates box-and-whisker plots, violin plots, histograms, scatter plots, Q–Q plots, stem-and-leaf displays and pie charts from pasted or uploaded datasets.It computes five-number summaries, flags outliers using Tukey IQR fences with adjustable sensitivity (1.5×, 2×, 3×) and offers jitter, mean and notch overlays.
Compare up to 10 datasets side-by-side with independent colors, notch displays and scatter overlays for group comparison and distribution analysis.
One-click export options (PNG, SVG, CSV, XLSX, HTML, Markdown) deliver publication-ready, watermark-free charts and data tables.Client-side computation runs entirely in the browser so data remains local and private.
Built-in AI analysis produces statistical summaries, distribution insights and custom visualization suggestions.The responsive interface requires no installation, accepts pasted numbers or files, and supports high-resolution exports for reports and presentations.
aiboxplot pricing
FreeThis tool is free to use, with no credit card required.
Verify on the official pricing page.
Get started freeaiboxplot's key features
-
Generates box-and-whisker, violin, histogram, scatter, Q–Q, stem-and-leaf and pie charts from pasted or uploaded datasets
-
Computes five-number summaries and detects outliers using adjustable Tukey IQR fences (with jitter, mean and notch overlay options)
-
Compares up to 10 datasets side-by-side with independent colors and overlay options (notch and scatter)
-
One-click exports to PNG, SVG, CSV, XLSX, HTML and Markdown with high-resolution output
-
Client-side, in-browser computation with a responsive no-install interface and built-in AI analysis for statistical summaries and visualization suggestions
aiboxplot use cases
-
Create publication-quality box-and-whisker, violin and scatter plots from pasted or uploaded data using the browser-based plot generator, export high-resolution charts for figures and presentations, and rely on built-in AI statistical summaries and Tukey IQR outlier flags to document methods and support results
-
Develop classroom assignments and interactive demonstrations by generating histograms, Q–Q and stem-and-leaf plots from student datasets, use five-number summaries and AI-driven explanations to teach interpretation, and keep sensitive student data private with client-side processing
-
Create fast data-quality and exploratory pipelines for analysts by comparing multiple datasets side-by-side, automatically flagging Tukey outliers and summarizing differences with AI-driven statistics, then export visuals for stakeholder reports without uploading data off the browser
aiboxplot user reviews
Based on 1 review, 100% of users recommend aiboxplot, rated highly for quality results.
Liked for
Would you recommend aiboxplot?
Who is aiboxplot for?
-
Data analysts
-
Researchers
-
Statisticians
-
Teachers
-
Business analysts
aiboxplot FAQ
Is aiboxplot free?
Yes. aiboxplot is free to use and does not require a credit card.
What are the best alternatives to aiboxplot?
The closest alternatives to aiboxplot are SciDraw AI, Graphy.app, AI graph maker, CalcGen AI and Piechartmaker.co. You can compare them side by side in the alternatives section further down this page.


