Downloadable Line Graph
The best 43 Downloadable Line Graph AI tools - Free & Paid
Explore 43 AI for Downloadable Line Graph
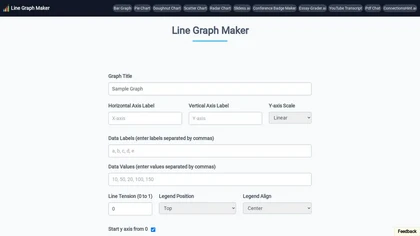
Line Graph Maker lets users input comma‑separated data to produce line charts in PNG, JPG, or SVG. Adjust titles, axis labels, Y‑axis scaling, line tension, legend, grids, colors, and download for reports or presentations.
Free

Pie Chart Maker lets users quickly create pie, doughnut, and 3‑D charts by entering comma‑separated labels and values. Adjust colors, legend placement, and rotation; export to PNG, JPEG, or SVG. Ideal for students, teachers, designers.
Free

Free AI Graph Maker enables users to create interactive charts and graphs, including bar, pie, and line charts. It supports Gantt charts, flowcharts, and mind maps, facilitating effective data visualization for various sectors like education and finance.
Freemium

Graphy transforms raw data from Google Sheets, CSV, Excel, or APIs into AI‑generated charts, auto‑highlighting insights. It supports multiple chart types, branding, annotations, real‑time updates, and export/embed options for marketing, finance, and consulting teams.
Freemium
- $16/mo

ChartGen.ai is an AI chart generator that converts CSV/Excel data or pasted text into presentation-ready visualizations using plain-English prompts. It supports numerous chart types, offers live data sync, and exports in multiple formats with enterprise-grade security.
Freemium
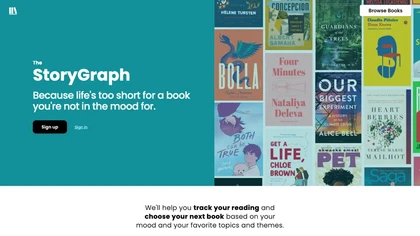
The StoryGraph is an AI-powered reading platform utilizing machine learning. It offers personalized book recommendations, stats tracking, customizable selections, mood/theme filters, live reactions, reading challenges, and content warnings for an immersive reading experience.
Free
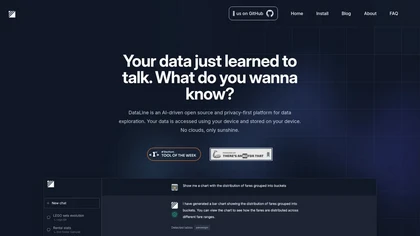
Dataline is an AI-powered data analysis and visualization tool that transforms chat data into structured formats. It supports various databases and promotes privacy by keeping data on user devices, catering to both technical and non-technical users.
Freemium

AI Infographic Generator converts text and data into customizable graphics like infographics and flowcharts. With over 500 templates and multi-language support, it enables editing and downloading in multiple formats, all while supporting 4K resolution.
Freemium
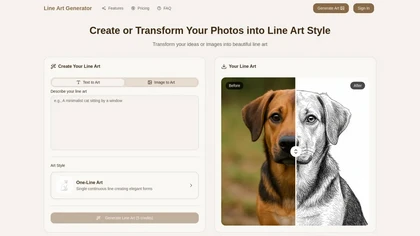
Line Art Generator transforms images and text into detailed line art sketches across eight styles, including minimalist and manga. Users can download high-resolution files without watermarks, ensuring clean and professional results.
Freemium
- $2.49/mo
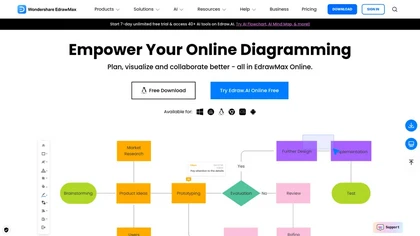
EdrawMax Online is a cloud diagramming platform with 210+ diagram types, including flowcharts, UML, and Gantt charts. It offers drag‑and‑drop editing, real‑time collaboration, 20,000 free templates, 26,000 symbols, and AI tools for diagram, chart, and PPT generation, OCR, and copy‑writing.
Freemium
- $5.33/mo

SciDraw AI is a scientific illustration and data visualization tool that converts text prompts, sketches, or images into publication-ready figures. It generates editable SVG/PPTX exports, data-driven charts from CSV/Excel, and supports journal style presets and colorblind-friendly palettes for repro
Free trial

ChartAI auto‑creates diverse visualizations—mind maps, flowcharts, timelines, Gantt charts, ER diagrams, etc.—by converting data into polished diagrams. It offers templates, quick start, and dataset generation, aiding analysts, researchers, educators, and managers.
Free

ChartGPT is an AI tool that facilitates easy creation and customization of multiple chart types for enhanced data visualization. It provides versatility in displaying data through various charts, ensuring clear and captivating presentations for diverse projects.
Freemium
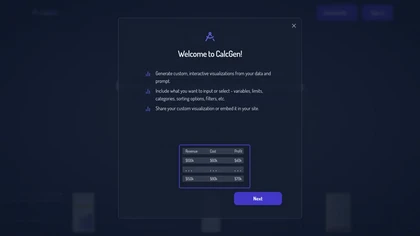
Calcgen AI enables users to create custom interactive charts, graphs, and calculators for data visualization. It includes tools for financial analysis, scientific calculations, and educational purposes, catering to a broad range of professional needs.
Subscription

vizGPT turns natural‑language queries and drag‑and‑drop into live dashboards and charts, retaining context for follow‑ups. It includes data tables for profiling and transforms, and design tools that generate Lottie JSON and SVG animations, enabling team collaboration.
Paid
- $10/mo
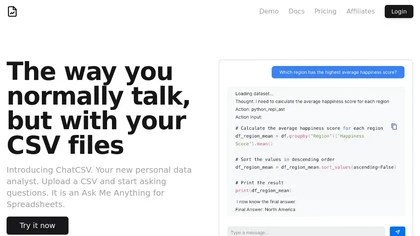
ChatCSV lets users upload CSV files from computer, URL, or clipboard and query data with natural language. It auto‑generates common questions and returns charted answers (bar, pie, custom). Interactions are saved, shareable, used for team collaboration across retail, finance, marketing.
Free
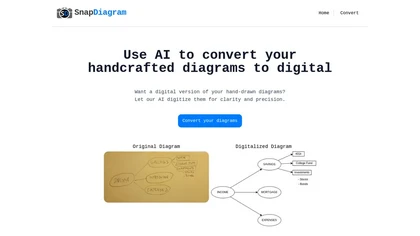
SnapDiagram uses AI to turn hand‑drawn diagrams into crisp digital images. It accepts any image format, outputs PNG, JPG, or editable files, lets users preview the conversion, and then download the refined result.
Freemium
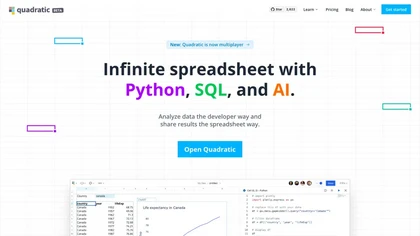
Quadratic is an AI‑enabled spreadsheet that connects to CSV, Excel, PDFs, and databases like Postgres and Snowflake. It lets users filter, clean, and analyze data in a grid, ask natural‑language queries, and generate editable Python and SQL code for visualizations.
Subscription
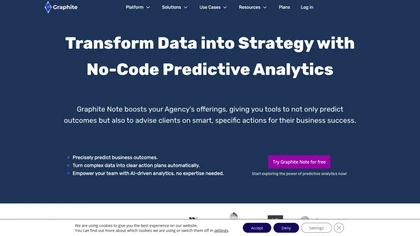
Graphite Note is a user-friendly, no-code predictive analytics tool for cross-industry teams. It delivers accurate predictions (outcomes, lead conversions), analyzes customer behavior, creates personalized marketing strategies, optimizes campaigns, and forecasts demand, simplifying complex data ana
Paid
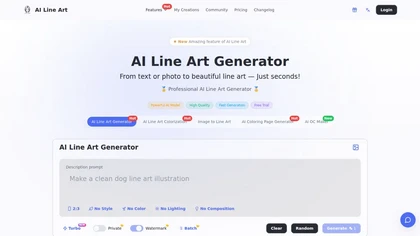
Creates print-ready line drawings and coloring pages from text prompts or photos, offering multiple styles (sketch, woodcut, continuous line, 3D), image-to-line-art colorization, prompt-based controls, batch generation, and high-resolution exports for design and illustration.
Free trial
- $8.33/mo
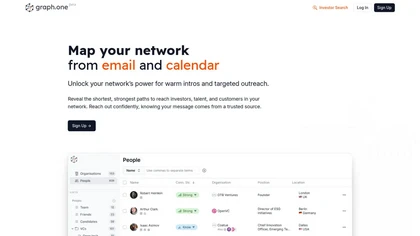
Graph.one is a desktop tool that maps professional networks using email and calendar data, enabling users to visualize connections, optimize fundraising efforts, and secure warm introductions while ensuring data privacy with strong encryption and compliance measures.
Freemium
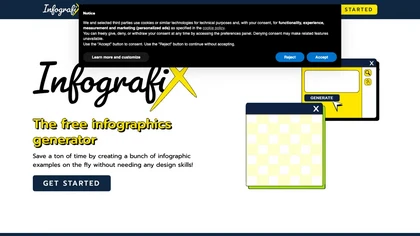
Infografix leverages Azure AI to turn text prompts into infographics—timelines, mind maps, SWOT analyses, family trees, and more—using templates, over 1,500 Google Fonts, and direct canvas editing. Export to PNG, JPG, SVG, PDF and share on social media.
Free

Converts text, images, PDFs and spreadsheets into editable diagrams—flowcharts, decision trees, UML, mindmaps, org charts and Gantt—by parsing processes into steps, decisions and loops, offering auto-layout, collaborative editing and PNG/SVG/PDF export.
Free trial
ChartPixel is an AI tool that generates charts and insights from messy data files or webpages using AI algorithms to clean and engineer new features, provide AI-assisted annotations and statistics to explore patterns and quirks in the data.
Freemium

SketchEdge uses AI to convert photos into soft, hand‑drawn line drawings. Upload high‑resolution images, adjust line thickness, and export as vector SVG or raster PNG. Batch processing and a simple web interface streamline the design workflow.
Freemium

InfographAI converts text, URLs, PDFs, Word docs, and spreadsheets into AI-generated infographics. It extracts key points, auto-places charts and visuals, offers customizable templates and a drag-and-drop editor, and exports PNG or PDF for reports and social media.
Freemium
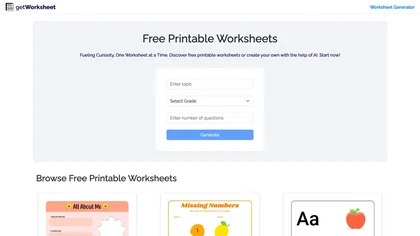
Worksheet Generator lets teachers create custom math, English, science, or social studies worksheets in seconds, setting grade level, question type, and difficulty. It supports PDF export and cloud storage for easy access from any device.
Freemium

Streamdown is a drop-in react-markdown replacement for AI-powered streaming Markdown rendering, supporting GFM, Shiki-highlighted code with copy/download, KaTeX math, Mermaid diagrams, CJK emphasis, Tailwind styling, streaming parsing and security filtering.
Freemium

History Timelines is an app that enables users to create and view timelines of historical events.
Free

MakeInfographic.ai converts text prompts into structured infographics using templates (timelines, comparisons, processes, etc.), selectable visual styles and aspect ratios, exports channel-specific variations for social, presentations, and educational materials with inline editing.
Free trial
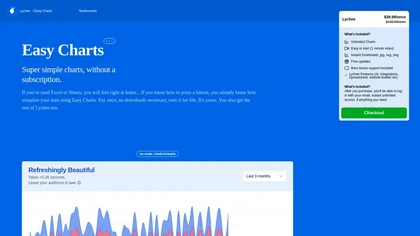
Easy Charts is an AI-powered tool for data visualizations and charts generation without the need for downloads. It offers unlimited chart generation, easy exports, and customization options, making charting effortless for all user levels.
Paid
- $39.99

Grapha.ai is an AI-enabled data exploration tool that swiftly reveals hidden trends and provides intuitive visualizations & insights from complex datasets without requiring any coding knowledge.
Subscription

PlotsAlot provides AI-assisted data analysis and visualization, turning CSV/Excel/SPSS/JSON/PDF/image uploads into interactive charts and full-stack dashboards via natural-language queries. Features include conversational data chat, predictive analytics, automated reporting, and reusable dashboards.
Free
- $10/mo
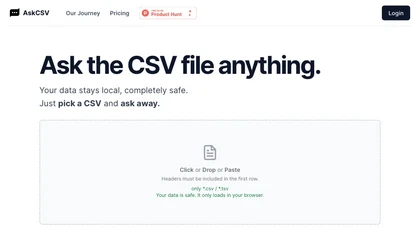
AskCSV lets users upload CSV/TSV files in the browser, query data locally, and receive automatic charts, tables, and insights—such as top products or ROI—while preserving privacy and requiring headers for accurate processing.
Freemium
ChartFast uses GPT‑4o to clean, normalize, and analyze datasets, then instantly generates customizable charts via natural‑language queries. Exportable to CSV/Excel, it supports Python scripts for large‑scale analysis, streamlining workflows for analysts and non‑technical users.
Subscription
- $9/mo
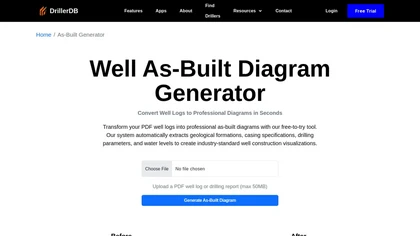
The As-Built Diagram Generator by DrillerDB allows well owners and drillers to create detailed as-built diagrams by uploading well logs. It extracts relevant data and adheres to industry standards, with options for PDF export and access to well records.
Freemium
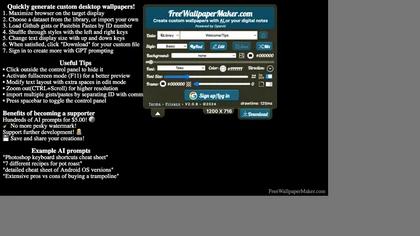
An AI‑powered web tool that generates custom desktop wallpapers, letting users embed notes, unit conversions, poker charts, trigonometry tables, eclipse schedules, time‑zone maps, and cheat sheets. It offers templates, font and background choices, and saves directly for Windows or macOS.
Freemium
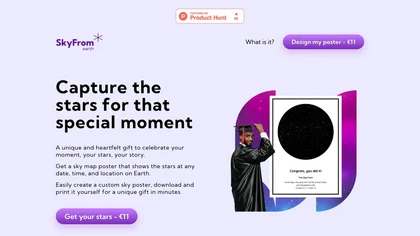
SkyFrom generates high‑resolution printable star‑maps for any date, time, and location using ESA Hipparcos data. Users choose a template, input details, add text, and download a 3956×5276 JPEG ready for print.
Paid
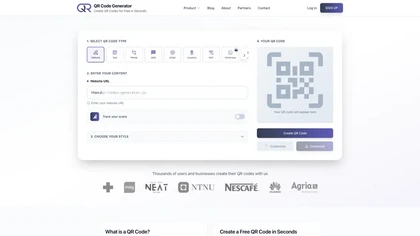
Create customizable 2D QR codes for URLs, text, contact info, WiFi, payments, events, and more. Choose static or dynamic options with real‑time scan analytics, color, logo, and export in PNG, JPG, SVG, or EPS up to 3200 px.
Freemium
- $14/mo
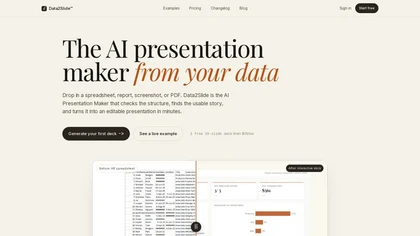
data2slide.com is a browser-based AI presentation maker that transforms CSVs, Excel files, PDFs, and text briefs into fully editable slide decks. It automatically checks data quality, detects chartable KPIs, and generates structured presentations with charts, tables, and summaries for export to HTML
Free trial
- $15/mo
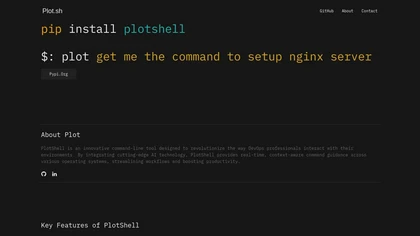
Plot.sh aggregates NFT transaction data across Solana, Ethereum, Base, Arbitrum, and Abstract to compute realized profit and loss per wallet or collection. It auto‑calculates fees, royalties, and inventory costs, and allows filtering, comparison, and audit‑ready export.
Freemium
Snipowl enables users to create live dashboards from web snapshots, consolidating data from multiple sources. It offers real-time updates, integrates with tools like Google Ads and HubSpot, and includes auto-refreshing data and email reporting features.
Free trial
- $100