Sports Data Visualization
The best 50 Sports Data Visualization AI tools - Free & Paid
Explore 50 AI for Sports Data Visualization

SwingVision is an on-device iOS app for tennis and pickleball that records matches, detects shots, tracks ball trajectory and player movement, and produces highlights, per-shot statistics, speed estimates, line-call indicators, exportable stats, and shareable session links.
Freemium


Graphy transforms raw data from Google Sheets, CSV, Excel, or APIs into AI‑generated charts, auto‑highlighting insights. It supports multiple chart types, branding, annotations, real‑time updates, and export/embed options for marketing, finance, and consulting teams.
Freemium
- $16/mo
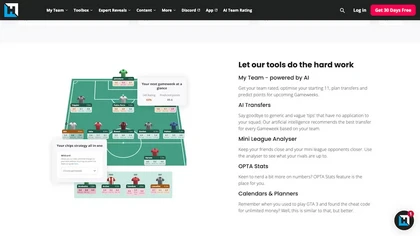
An AI‑powered Fantasy Premier League assistant that evaluates squads, recommends lineups, suggests transfers based on form and fixtures, tracks mini‑league standings, provides OPta stats for player comparisons, and includes a calendar for chip planning.
Free trial
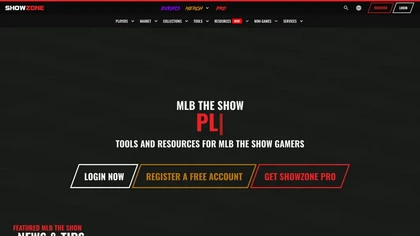
ShowZone delivers MLB The Show players a real‑time card database, flipping analytics, mission optimization, roster projections, team building, and inventory tracking. Data updates every five minutes, with PRO members getting minute‑level refreshes.
Freemium

Pie Chart Maker lets users quickly create pie, doughnut, and 3‑D charts by entering comma‑separated labels and values. Adjust colors, legend placement, and rotation; export to PNG, JPEG, or SVG. Ideal for students, teachers, designers.
Free
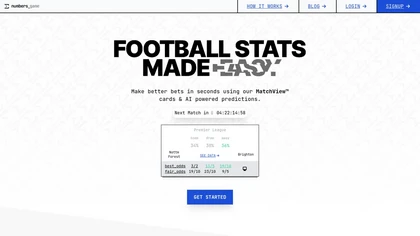
Numbers Game is a football statistics platform that employs machine learning for accurate betting predictions. It offers insights through MatchView™ cards, compares odds across bookmakers, and fosters a community for shared tips and strategies.
Free

Volt Intelligence is an AI analytics tool for baseball, featuring a digital teammate for instant insights on player data and stats. It offers extensive player coverage, custom notebooks, multi-lingual reports, and robust data security.
Freemium

vizGPT turns natural‑language queries and drag‑and‑drop into live dashboards and charts, retaining context for follow‑ups. It includes data tables for profiling and transforms, and design tools that generate Lottie JSON and SVG animations, enabling team collaboration.
Paid
- $10/mo
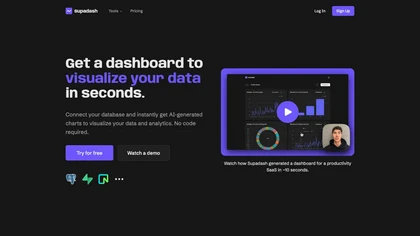
Supadash lets users connect to SQL databases like PostgreSQL or Supabase and automatically turns SELECT results into time‑series and bar charts without manual coding. It supports unlimited charts per project, offers AI‑generated layouts, and stores no user data.
Subscription
- $7/mo
Pixellot is an AI‑powered sports production platform that automatically records, streams, and analyzes games across 19 sports. It deploys camera rigs, generates live graphics, commentary, and highlights, and supplies analytics for coaching and remote venue management.
Free

DeepBetting uses machine learning on a decade of football, NBA, NFL, NHL, and MLB data to produce real‑time, timestamped predictions that highlight statistical edges over market odds. Users view results via an online dashboard with full logging for transparency.
Paid
ChartPixel is an AI tool that generates charts and insights from messy data files or webpages using AI algorithms to clean and engineer new features, provide AI-assisted annotations and statistics to explore patterns and quirks in the data.
Freemium


Machina Sports offers an AI‑powered sports operating system delivering live scores, xG, win probability, and player stats through a single API. It auto‑generates match‑event outputs and supports sub‑100 ms edge caching for broadcasters, betting, teams, and fan apps.
Freemium
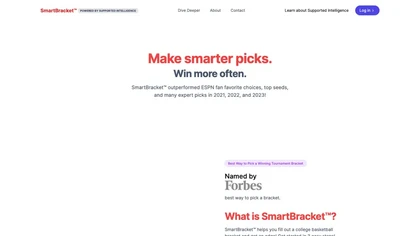
SmartBracket is an AI‑powered platform that helps college basketball fans and tournament organizers build and compare brackets quickly. It uses data on team stats, seeds, and history to generate multiple bracket options and syncs with ESPN’s leaderboard for performance tracking.
Freemium

Free AI Graph Maker enables users to create interactive charts and graphs, including bar, pie, and line charts. It supports Gantt charts, flowcharts, and mind maps, facilitating effective data visualization for various sectors like education and finance.
Freemium
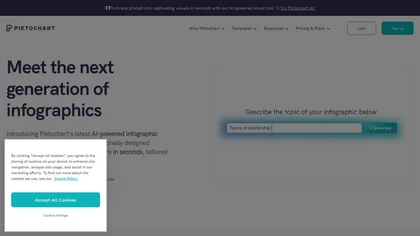
Piktochart is an AI‑powered visual creation platform that turns text into infographics, charts, and videos within seconds. It offers templates, a brand kit, collaborative editing, interactive graphics, and export options for print and digital use.
Freemium

Gridcast Sports Guide is an AI tool that provides real-time sports analytics and personalized game predictions. It enhances fan engagement with interactive visualizations and tailored content for teams and leagues.
Freemium
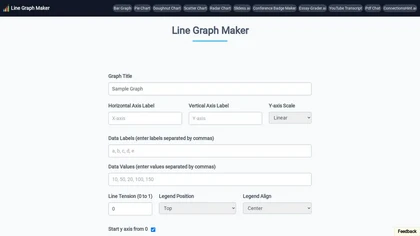
Line Graph Maker lets users input comma‑separated data to produce line charts in PNG, JPG, or SVG. Adjust titles, axis labels, Y‑axis scaling, line tension, legend, grids, colors, and download for reports or presentations.
Free

Be Your Best tracks athlete vision and decision‑making by measuring scan rate during gameplay. It offers real‑time data, progress tracking, leaderboards, and analytics for coaches and analysts to enhance tactical flexibility and possession control.
Freemium

AI Predictions provides data‑driven football forecasts—over/under totals, match outcomes, and win/draw results—with accuracy percentages. Users filter by league, view past stats, compare predictions, and use insights to evaluate betting lines and team performance.
Freemium

TennisPredictions.ai uses machine learning and statistical models to produce real-time win probabilities, set-score projections and game totals across ATP, WTA, Challenger, ITF and Grand Slams, with player stats, head-to-head, surface and serve/return metrics.
Freemium
Kanaries transforms raw data into interactive visual insights with AI‑assisted code completion for Pandas, RStudio, and Jupyter. Drag‑and‑drop chart building, natural‑language chat, real‑time collaboration, and offline desktop support streamline the entire exploration workflow across web and desktop
Subscription
Quadratic is an AI‑enabled spreadsheet that connects to CSV, Excel, PDFs, and databases like Postgres and Snowflake. It lets users filter, clean, and analyze data in a grid, ask natural‑language queries, and generate editable Python and SQL code for visualizations.
Subscription

SciDraw AI is a scientific illustration and data visualization tool that converts text prompts, sketches, or images into publication-ready figures. It generates editable SVG/PPTX exports, data-driven charts from CSV/Excel, and supports journal style presets and colorblind-friendly palettes for repro
Free trial

No-Code KPI Dashboard AI by Sqor Value enables users to create customizable KPI dashboards without coding, offering drag-and-drop functionality and integration with various data sources for real-time performance monitoring and strategic planning.
Freemium


PlotsAlot provides AI-assisted data analysis and visualization, turning CSV/Excel/SPSS/JSON/PDF/image uploads into interactive charts and full-stack dashboards via natural-language queries. Features include conversational data chat, predictive analytics, automated reporting, and reusable dashboards.
Free
- $10/mo

Flowpoint offers a single‑panel dashboard that aggregates key website analytics: top traffic sources, high‑performing pages, real‑time audience by geography, and detailed event timelines. It provides step‑by‑step funnel analysis and session recordings to pinpoint conversion drop‑offs.
Freemium
- $5/mo

Lotto Chart uses machine learning to analyze historical lottery data and generate seven predictive models for U.S. state and multi‑state games like Powerball and Mega Millions. Daily updates and analytics reports help users compare performance and identify statistically robust combinations.
Freemium
DataSquirrel.ai automates data cleaning, analysis, and visualization for business users, enabling quick chart creation, KPI dashboards, and custom reports without coding. It supports scheduled refreshes, GDPR compliance, and interactive sharing for teams and consultants.
Paid
- $15

ScoreGenius is an AI-powered football betting prediction tool that analyzes over 1,000 data points and historical data. It offers tailored insights to enhance betting strategies, achieving an 81% success rate in predicting match outcomes.
Subscription

Wingfield AI Sports Cameras record padel, tennis, and pickleball matches, auto‑generating highlight clips for social media. Coaches gain instant replay, match analytics, VAR‑style review, and skill metrics for player development and remote live streaming.
Freemium

ChartGen.ai is an AI chart generator that converts CSV/Excel data or pasted text into presentation-ready visualizations using plain-English prompts. It supports numerous chart types, offers live data sync, and exports in multiple formats with enterprise-grade security.
Freemium

Grapha.ai is an AI-enabled data exploration tool that swiftly reveals hidden trends and provides intuitive visualizations & insights from complex datasets without requiring any coding knowledge.
Subscription
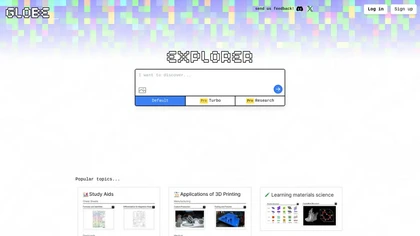
Globe Explorer is an AI-driven platform for data analysis and trend identification, offering robust topic discovery, visual data representations, insightful reports, and collaborative features to enhance research for educators, researchers, and content creators.
Freemium

ChartGPT is an AI tool that facilitates easy creation and customization of multiple chart types for enhanced data visualization. It provides versatility in displaying data through various charts, ensuring clear and captivating presentations for diverse projects.
Freemium
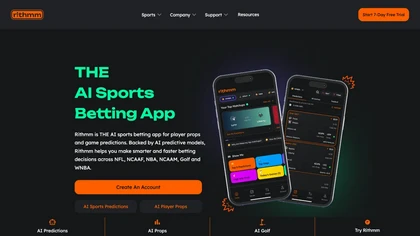
Rithmm uses AI to generate predictive models for player props and game outcomes in major sports leagues. It offers Smart Signals with line recommendations, a no‑code model builder, odds comparison, team/player insights, and performance tracking for individual or group bettors.
Paid
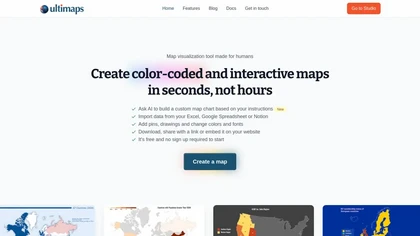
Ultimaps is a user-friendly tool for creating interactive, color-coded maps quickly. It supports data import from various sources and offers features like pins, editable legends, and tooltips, with no sign-up required for basic use.
Freemium
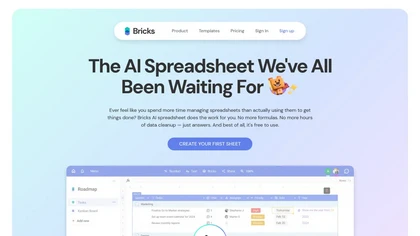
Bricks AI transforms CSV, Excel, Google Sheets, and database files into instant interactive dashboards and reports. It auto‑creates charts, lets users edit data via natural‑language commands, refreshes with one click, and offers reusable templates with encrypted privacy.
Freemium
- $25/mo
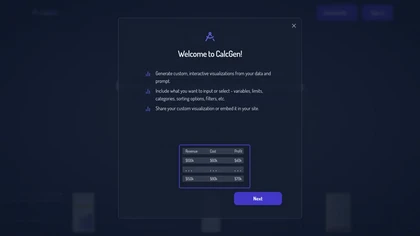
Calcgen AI enables users to create custom interactive charts, graphs, and calculators for data visualization. It includes tools for financial analysis, scientific calculations, and educational purposes, catering to a broad range of professional needs.
Subscription
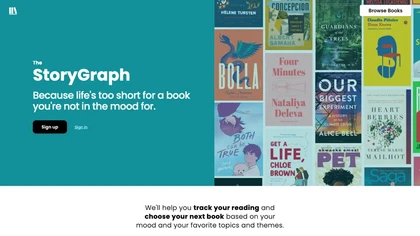
The StoryGraph is an AI-powered reading platform utilizing machine learning. It offers personalized book recommendations, stats tracking, customizable selections, mood/theme filters, live reactions, reading challenges, and content warnings for an immersive reading experience.
Free
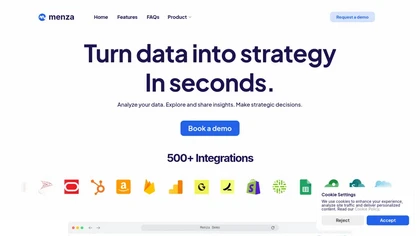
Menza is a data analytics platform that transforms unstructured data into actionable insights through over 500 integrations. Its interactive dashboards, user-friendly interface, and strong security features support strategic decision-making for businesses without requiring technical expertise.
worldmonitor.app is a real-time global intelligence dashboard that overlays live signals from 500+ feeds and 65+ data providers onto an interactive map. It correlates geopolitical events, infrastructure outages, and sensor alerts with market movements for analysts, traders, and risk managers.
Freemium


ChartAI auto‑creates diverse visualizations—mind maps, flowcharts, timelines, Gantt charts, ER diagrams, etc.—by converting data into polished diagrams. It offers templates, quick start, and dataset generation, aiding analysts, researchers, educators, and managers.
Free