
Charting Libraries
The best 50 Charting Libraries AI tools - Free & Paid
Explore 50 AI for Charting Libraries
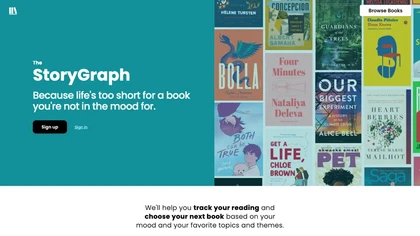
The StoryGraph is an AI-powered reading platform utilizing machine learning. It offers personalized book recommendations, stats tracking, customizable selections, mood/theme filters, live reactions, reading challenges, and content warnings for an immersive reading experience.
Free
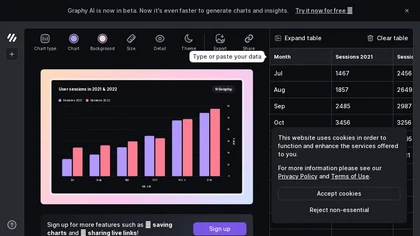
Graphy transforms raw data from Google Sheets, CSV, Excel, or APIs into AI‑generated charts, auto‑highlighting insights. It supports multiple chart types, branding, annotations, real‑time updates, and export/embed options for marketing, finance, and consulting teams.
Freemium
- $16/mo
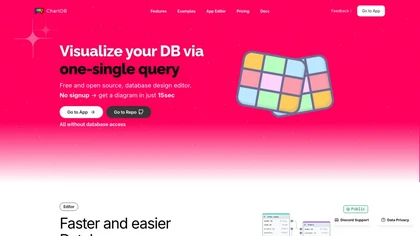
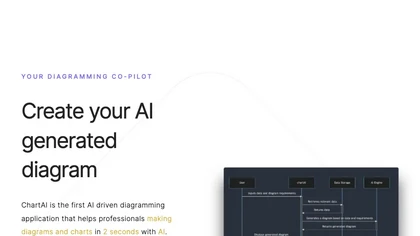
ChartAI auto‑creates diverse visualizations—mind maps, flowcharts, timelines, Gantt charts, ER diagrams, etc.—by converting data into polished diagrams. It offers templates, quick start, and dataset generation, aiding analysts, researchers, educators, and managers.
Free
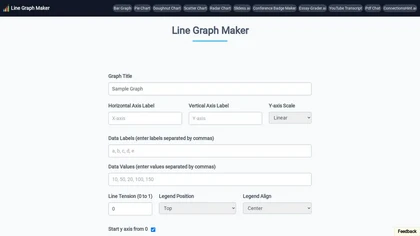
Line Graph Maker lets users input comma‑separated data to produce line charts in PNG, JPG, or SVG. Adjust titles, axis labels, Y‑axis scaling, line tension, legend, grids, colors, and download for reports or presentations.
Free
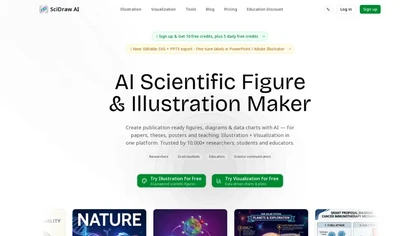
SciDraw AI is a scientific illustration and data visualization tool that converts text prompts, sketches, or images into publication-ready figures. It generates editable SVG/PPTX exports, data-driven charts from CSV/Excel, and supports journal style presets and colorblind-friendly palettes for repro
Free trial

Chart provides programmatic access to verified tax records by connecting to IRS Online Accounts and major tax software, converting documents via OCR into structured JSON for income verification, underwriting, and onboarding, with REST APIs, SDKs and strong privacy controls.
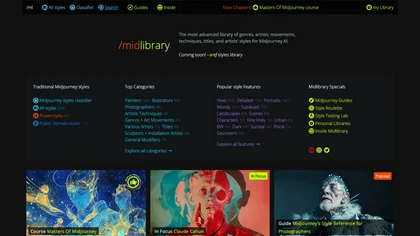
Midlibrary offers a database of 4,000+ SREF codes linked to 5,500+ artistic styles, artists, and techniques for Midjourney prompt engineering. It provides guides, benchmarks, a color roulette, tools for organizing prompts, upscaling images, and converting outputs to 3D models.
Free
ChartX automates billing and claim management for elder care, assisted living, and home health. AI‑driven onboarding updates patient records with a single click, encrypts data, supports denial handling, real‑time cloud sync, and delivers analytics for revenue insight across facility sizes.
Paid
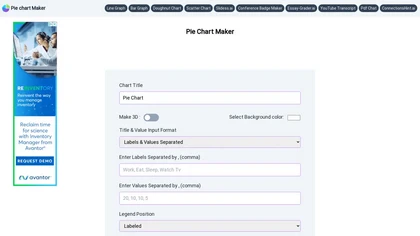
Pie Chart Maker lets users quickly create pie, doughnut, and 3‑D charts by entering comma‑separated labels and values. Adjust colors, legend placement, and rotation; export to PNG, JPEG, or SVG. Ideal for students, teachers, designers.
Free
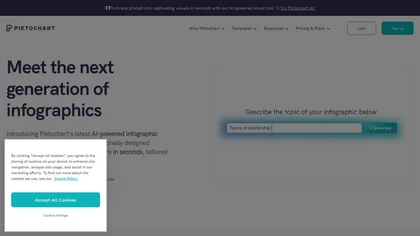
Piktochart is an AI‑powered visual creation platform that turns text into infographics, charts, and videos within seconds. It offers templates, a brand kit, collaborative editing, interactive graphics, and export options for print and digital use.
Freemium
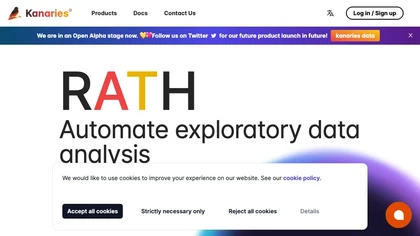
Kanaries transforms raw data into interactive visual insights with AI‑assisted code completion for Pandas, RStudio, and Jupyter. Drag‑and‑drop chart building, natural‑language chat, real‑time collaboration, and offline desktop support streamline the entire exploration workflow across web and desktop
Subscription
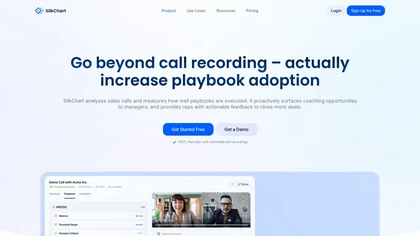

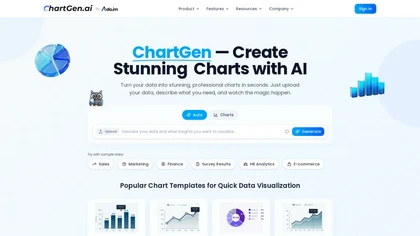
ChartGen.ai is an AI chart generator that converts CSV/Excel data or pasted text into presentation-ready visualizations using plain-English prompts. It supports numerous chart types, offers live data sync, and exports in multiple formats with enterprise-grade security.
Freemium
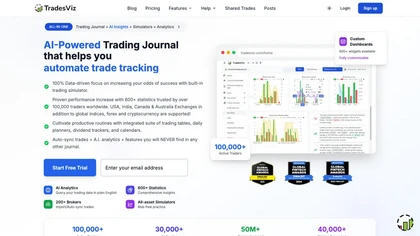

AdsLibrary is an ad management tool that helps users save, organize, and analyze ads across TikTok, YouTube, and social platforms, with real-time competitor tracking. It offers a 600,000+ ad library, Chrome extension for quick saving, and team collaboration features like shared ad groups.
Freemium
- $19/mo

paperclip is an open-source, self-hosted AI orchestration platform for creating and managing autonomous companies and agent teams—providing role-based hiring, goal-driven task delegation, budgeting, audit trails, multi-tenant deployment, extensible LLM integrations, and monitoring dashboards.
Free
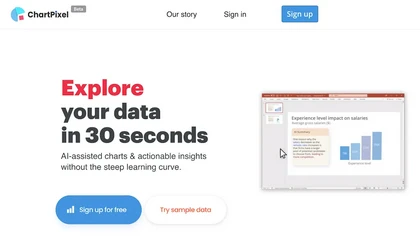
ChartPixel is an AI tool that generates charts and insights from messy data files or webpages using AI algorithms to clean and engineer new features, provide AI-assisted annotations and statistics to explore patterns and quirks in the data.
Freemium
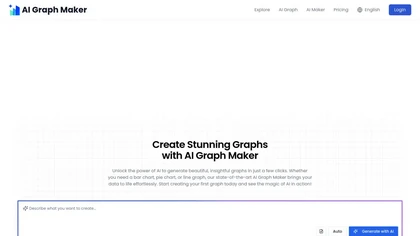
Free AI Graph Maker enables users to create interactive charts and graphs, including bar, pie, and line charts. It supports Gantt charts, flowcharts, and mind maps, facilitating effective data visualization for various sectors like education and finance.
Freemium
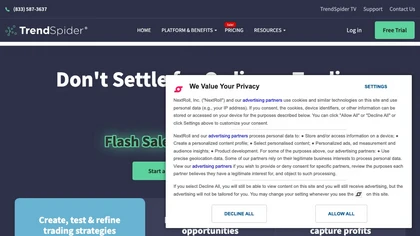
Trendspid is a comprehensive trade platform offering technical analysis tools, price alerts, market scanning, backtesting strategies, raindrop charts, unusual option flow tracking, and a 7-day free trial with market data from multiple sources.
Free trial
- $149/mo
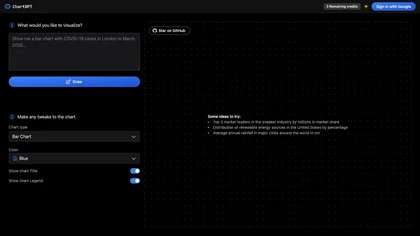
ChartGPT is an AI tool that facilitates easy creation and customization of multiple chart types for enhanced data visualization. It provides versatility in displaying data through various charts, ensuring clear and captivating presentations for diverse projects.
Freemium
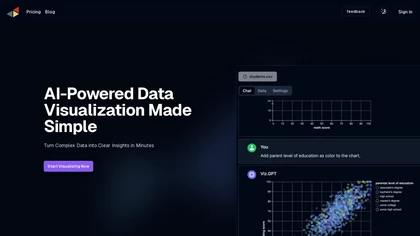
vizGPT turns natural‑language queries and drag‑and‑drop into live dashboards and charts, retaining context for follow‑ups. It includes data tables for profiling and transforms, and design tools that generate Lottie JSON and SVG animations, enabling team collaboration.
Paid
- $10/mo
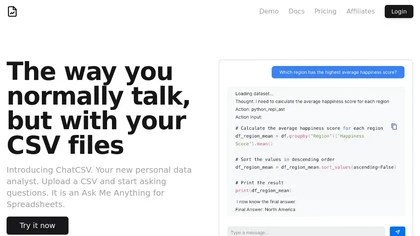
ChatCSV lets users upload CSV files from computer, URL, or clipboard and query data with natural language. It auto‑generates common questions and returns charted answers (bar, pie, custom). Interactions are saved, shareable, used for team collaboration across retail, finance, marketing.
Free

AI Infographic Generator converts text and data into customizable graphics like infographics and flowcharts. With over 500 templates and multi-language support, it enables editing and downloading in multiple formats, all while supporting 4K resolution.
Freemium

Lotto Chart uses machine learning to analyze historical lottery data and generate seven predictive models for U.S. state and multi‑state games like Powerball and Mega Millions. Daily updates and analytics reports help users compare performance and identify statistically robust combinations.
Freemium
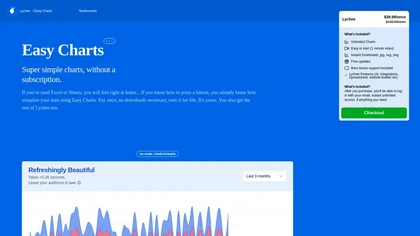
Easy Charts is an AI-powered tool for data visualizations and charts generation without the need for downloads. It offers unlimited chart generation, easy exports, and customization options, making charting effortless for all user levels.
Paid
- $39.99
StoryCanvas is a comprehensive writing tool that offers text editing, spelling correction, character development, and organizational features like boards and mind maps, supporting writers throughout the creative process and improving their work's grammar and style.
Free
Libromatch is an AI-driven platform that offers personalized book recommendations based on users' favorite titles, genres, and themes. It prioritizes user privacy, enhancing the reading experience by helping readers discover new authors and expand their libraries.
Freemium
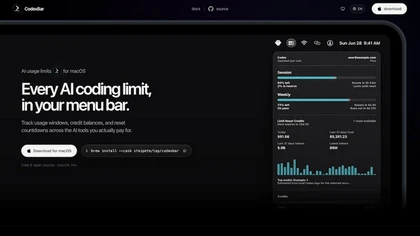
Codexbar integrates with Cursor to centralize session-based authentication and API usage reporting, surfacing per-model and billing-window metrics, provider cost estimates, account selection, storage footprint, and CLI/manual login options for developer, DevOps, and security teams.
Free

Converts text, images, PDFs and spreadsheets into editable diagrams—flowcharts, decision trees, UML, mindmaps, org charts and Gantt—by parsing processes into steps, decisions and loops, offering auto-layout, collaborative editing and PNG/SVG/PDF export.
Free trial
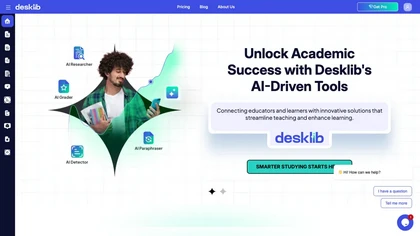
Desklib is an AI-powered academic toolkit that offers tools like an AI Grader, Plagiarism Checker, and AI Paraphraser to support students and educators. It streamlines assignment evaluation, enhances learning, and aids in research and assessments.
Free trial
Atlas automatically generates lecture notes, flashcards, and quizzes from course materials, offers step‑by‑step problem explanations and essay drafting, and answers specific class queries, integrating with common learning platforms for seamless syllabus access.
Free
Papers manages research libraries by importing and auto‑matching bibliographic data, letting users tag, rate, and organize sources. AI offers article recommendations and chat queries, while inline annotations sync across Mac, Windows, and mobile. SmartCite supports 10,000+ styles and integrates impa
Freemium
- $7/mo

Ada Medical Library offers a searchable, physician‑curated database of peer‑reviewed health information. Covering conditions like headaches and seasonal affective disorder, it provides plain‑language explanations to help patients self‑manage and prepare for provider discussions.
Freemium
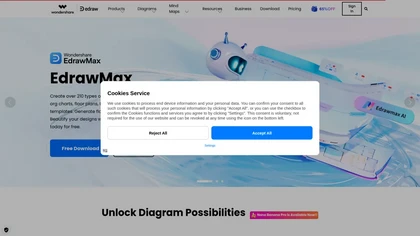
Edraw Software is a versatile diagramming tool that enables users to create flowcharts, mind maps, and organizational charts with ease. Its drag-and-drop functionality, collaboration features, and support for multiple file formats enhance productivity and integration.
- $59
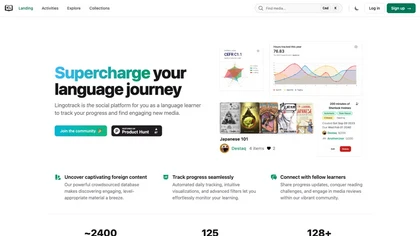
Lingotrack automates language‑learning progress tracking, visualizes study data, and offers a crowdsourced database of foreign media sorted by difficulty. Users log consumption with one‑click or GPT‑powered input, view dashboards, and join community challenges and reviews.
Subscription
Calcgen AI enables users to create custom interactive charts, graphs, and calculators for data visualization. It includes tools for financial analysis, scientific calculations, and educational purposes, catering to a broad range of professional needs.
Subscription
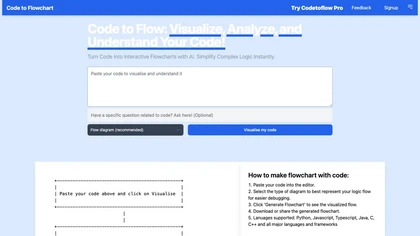
Code to Flowchart converts source code into interactive flowcharts, sequence, and class diagrams for Python, JavaScript, Java, C++, and TypeScript. It visualizes logic paths, loops, and conditionals, supports export to SVG/PNG/PDF, and prioritizes privacy with no code storage.
Subscription
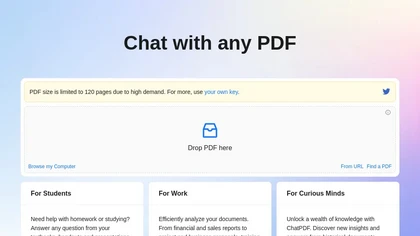
ChatPDF lets users upload PDFs for conversational queries, mapping content and providing cited answers. It supports folders for combined documents, side‑by‑side chat and source viewing, and offers multilingual input and output.
Free
- $5
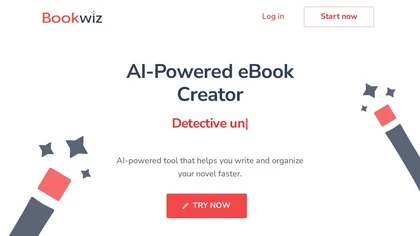
Bookwiz is an AI‑powered writing platform that stores a comprehensive Story Bible, automatically referencing it to maintain consistency across scenes and volumes. It tracks plot threads, character arcs, and timeline accuracy, and offers version control and series‑wide planning tools.
Subscription
- $11.67/mo
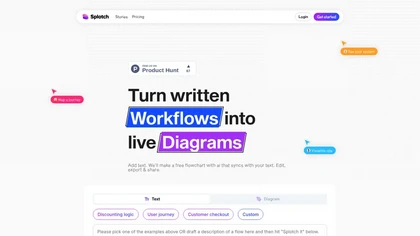
Splotch is a free AI flowchart generator that converts textual workflows into interactive diagrams, facilitating easy visualization, collaboration, and communication for teams in various fields, including product management, marketing, and e-commerce.
Free trial
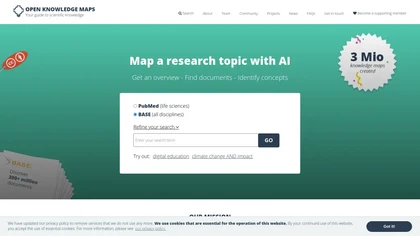
Open Knowledge Maps is an AI search engine that visualizes scientific literature across disciplines, clustering related papers to reveal topic connections and trends. It supports varied document types, offers high‑quality metadata, multilingual browsing, and open‑source integration.
Freemium

ChapterChat is a community-driven app for readers that simplifies bookshelf cataloging, offers digital book clubs, and features an AI-driven character for discussions. It also provides personalized book recommendations, enhancing the overall reading experience.
Freemium

PlotsAlot provides AI-assisted data analysis and visualization, turning CSV/Excel/SPSS/JSON/PDF/image uploads into interactive charts and full-stack dashboards via natural-language queries. Features include conversational data chat, predictive analytics, automated reporting, and reusable dashboards.
Free
- $10/mo

SnapTrader AI analyzes charts to detect historical patterns, support/resistance, and smart entry/exit points for swing, day, and scalp traders. It provides position-sizing, risk profiles, trade journaling, performance analytics, and platform integrations for fast analysis.
Free trial
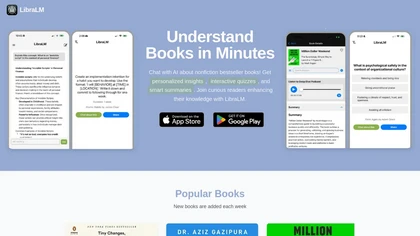
Libralm is an AI tool that offers concise summaries, personalized insights, and interactive quizzes for nonfiction bestsellers, enabling users to quickly grasp core concepts and engage meaningfully with literature, even with limited time.
Freemium

Lettria transforms unstructured PDFs into structured knowledge graphs, enabling precise, traceable answers in regulated sectors. Its NLP modules extract tables, diagrams, entities, and relationships, combining graph retrieval with vector search to improve accuracy and support audit‑ready compliance
Freemium