Time Series Chart
The best 50 Time Series Chart AI tools - Free & Paid
Explore 50 AI for Time Series Chart
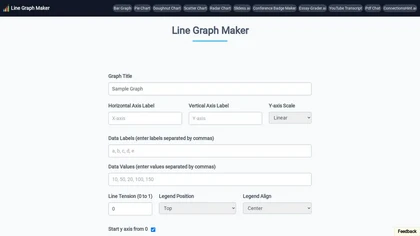
Line Graph Maker lets users input comma‑separated data to produce line charts in PNG, JPG, or SVG. Adjust titles, axis labels, Y‑axis scaling, line tension, legend, grids, colors, and download for reports or presentations.
Free
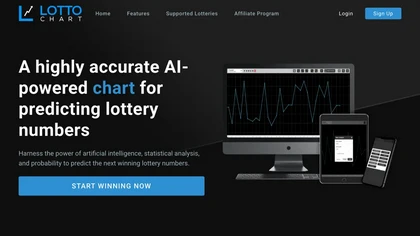
Lotto Chart uses machine learning to analyze historical lottery data and generate seven predictive models for U.S. state and multi‑state games like Powerball and Mega Millions. Daily updates and analytics reports help users compare performance and identify statistically robust combinations.
Freemium

ChartGPT is an AI tool that facilitates easy creation and customization of multiple chart types for enhanced data visualization. It provides versatility in displaying data through various charts, ensuring clear and captivating presentations for diverse projects.
Freemium
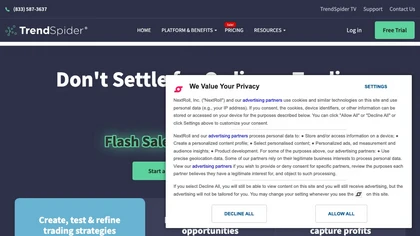
Trendspid is a comprehensive trade platform offering technical analysis tools, price alerts, market scanning, backtesting strategies, raindrop charts, unusual option flow tracking, and a 7-day free trial with market data from multiple sources.
Free trial
- $149/mo

ChartGen.ai is an AI chart generator that converts CSV/Excel data or pasted text into presentation-ready visualizations using plain-English prompts. It supports numerous chart types, offers live data sync, and exports in multiple formats with enterprise-grade security.
Freemium

Pie Chart Maker lets users quickly create pie, doughnut, and 3‑D charts by entering comma‑separated labels and values. Adjust colors, legend placement, and rotation; export to PNG, JPEG, or SVG. Ideal for students, teachers, designers.
Free

ChartAI auto‑creates diverse visualizations—mind maps, flowcharts, timelines, Gantt charts, ER diagrams, etc.—by converting data into polished diagrams. It offers templates, quick start, and dataset generation, aiding analysts, researchers, educators, and managers.
Free

Graphy transforms raw data from Google Sheets, CSV, Excel, or APIs into AI‑generated charts, auto‑highlighting insights. It supports multiple chart types, branding, annotations, real‑time updates, and export/embed options for marketing, finance, and consulting teams.
Freemium
- $16/mo
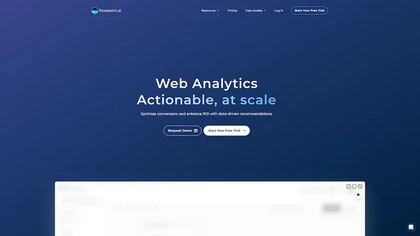
Flowpoint offers a single‑panel dashboard that aggregates key website analytics: top traffic sources, high‑performing pages, real‑time audience by geography, and detailed event timelines. It provides step‑by‑step funnel analysis and session recordings to pinpoint conversion drop‑offs.
Freemium
- $5/mo

vizGPT turns natural‑language queries and drag‑and‑drop into live dashboards and charts, retaining context for follow‑ups. It includes data tables for profiling and transforms, and design tools that generate Lottie JSON and SVG animations, enabling team collaboration.
Paid
- $10/mo
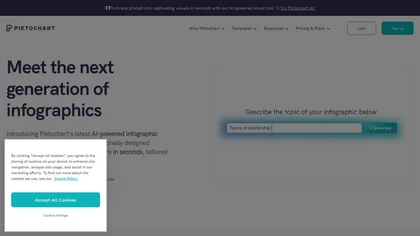
Piktochart is an AI‑powered visual creation platform that turns text into infographics, charts, and videos within seconds. It offers templates, a brand kit, collaborative editing, interactive graphics, and export options for print and digital use.
Freemium

Free AI Graph Maker enables users to create interactive charts and graphs, including bar, pie, and line charts. It supports Gantt charts, flowcharts, and mind maps, facilitating effective data visualization for various sectors like education and finance.
Freemium
ChartPixel is an AI tool that generates charts and insights from messy data files or webpages using AI algorithms to clean and engineer new features, provide AI-assisted annotations and statistics to explore patterns and quirks in the data.
Freemium
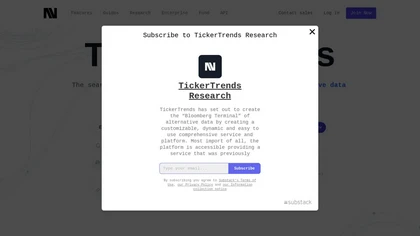
TickerTrends is an alternative data platform offering insights into market trends and consumer behavior through a robust search engine. It analyzes social media sentiment, web traffic, and app downloads, helping users identify emerging opportunities and monitor competitor performance.
Subscription
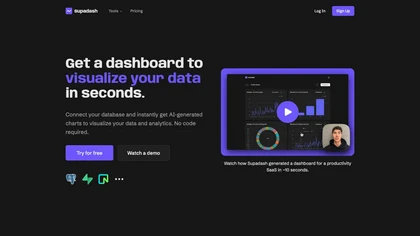
Supadash lets users connect to SQL databases like PostgreSQL or Supabase and automatically turns SELECT results into time‑series and bar charts without manual coding. It supports unlimited charts per project, offers AI‑generated layouts, and stores no user data.
Subscription
- $7/mo

History Timelines is an app that enables users to create and view timelines of historical events.
Free
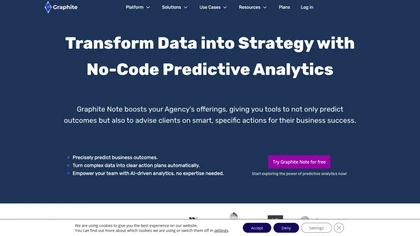
Graphite Note is a user-friendly, no-code predictive analytics tool for cross-industry teams. It delivers accurate predictions (outcomes, lead conversions), analyzes customer behavior, creates personalized marketing strategies, optimizes campaigns, and forecasts demand, simplifying complex data ana
Paid
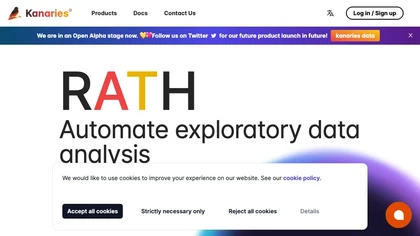
Kanaries transforms raw data into interactive visual insights with AI‑assisted code completion for Pandas, RStudio, and Jupyter. Drag‑and‑drop chart building, natural‑language chat, real‑time collaboration, and offline desktop support streamline the entire exploration workflow across web and desktop
Subscription
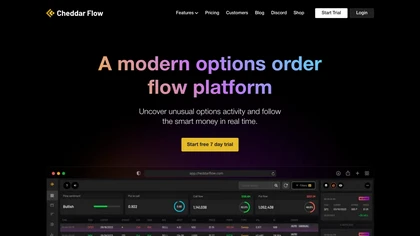
Cheddar Flow delivers real‑time options order flow and high‑frequency data, including dark‑pool and inter‑exchange sweeps. It aggregates gamma exposure, highlights price magnets and support/resistance zones, and AI alerts flag unusual activity for informed trading decisions.
Freemium
- $85/mo
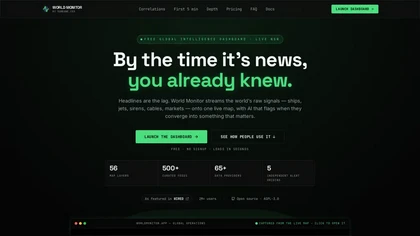
worldmonitor.app is a real-time global intelligence dashboard that overlays live signals from 500+ feeds and 65+ data providers onto an interactive map. It correlates geopolitical events, infrastructure outages, and sensor alerts with market movements for analysts, traders, and risk managers.
Freemium
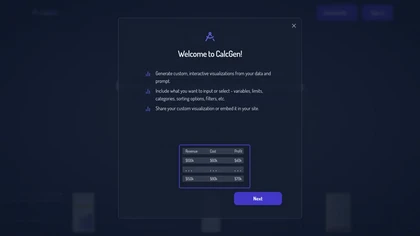
Calcgen AI enables users to create custom interactive charts, graphs, and calculators for data visualization. It includes tools for financial analysis, scientific calculations, and educational purposes, catering to a broad range of professional needs.
Subscription
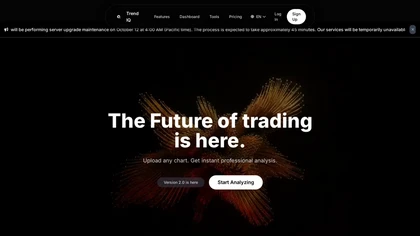
Trend IQ is an AI tool that analyzes chart screenshots for crypto, stocks, futures, and forex. It offers pattern recognition, risk management tools, and automated trade journaling to enhance swing and scalp trading while prioritizing user security and data privacy.
Subscription
- $14.99
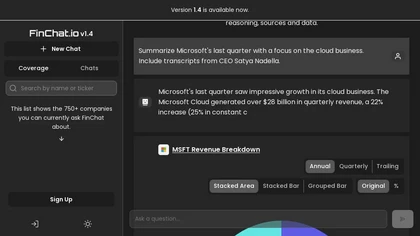
Fiscal.ai Terminal offers a public‑company research platform with global financial data for stocks, ETFs, and funds. It aggregates investor‑relations content, KPI and analyst estimates, delivers AI summaries, customizable dashboards, real‑time feeds, portfolio tracking, notifications, and low‑latenc
Freemium
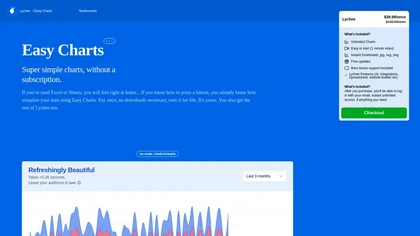
Easy Charts is an AI-powered tool for data visualizations and charts generation without the need for downloads. It offers unlimited chart generation, easy exports, and customization options, making charting effortless for all user levels.
Paid
- $39.99
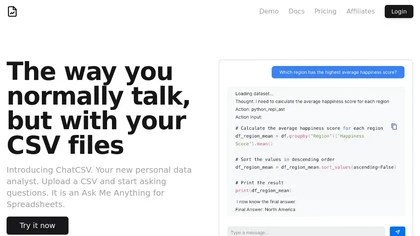
ChatCSV lets users upload CSV files from computer, URL, or clipboard and query data with natural language. It auto‑generates common questions and returns charted answers (bar, pie, custom). Interactions are saved, shareable, used for team collaboration across retail, finance, marketing.
Free
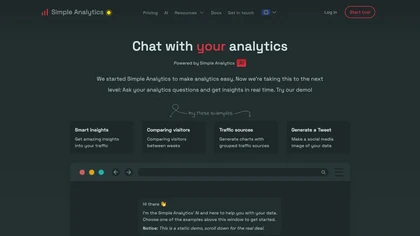
Simple Analytics AI lets website owners and marketers query traffic data with natural language, delivering instant insights, comparison charts, and social‑ready snippets. It provides quick, actionable analysis without complex reporting, ideal for analysts, growth marketers, and small businesses.
Freemium
- $15/mo
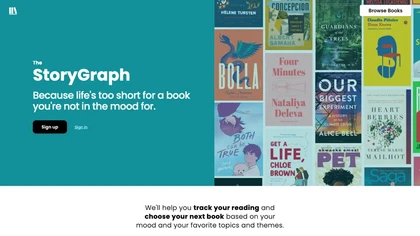
The StoryGraph is an AI-powered reading platform utilizing machine learning. It offers personalized book recommendations, stats tracking, customizable selections, mood/theme filters, live reactions, reading challenges, and content warnings for an immersive reading experience.
Free

SnapTrader AI analyzes charts to detect historical patterns, support/resistance, and smart entry/exit points for swing, day, and scalp traders. It provides position-sizing, risk profiles, trade journaling, performance analytics, and platform integrations for fast analysis.
Free trial

Chart provides programmatic access to verified tax records by connecting to IRS Online Accounts and major tax software, converting documents via OCR into structured JSON for income verification, underwriting, and onboarding, with REST APIs, SDKs and strong privacy controls.

History Timeline Generator creates chronological lists of key dates and events for people, companies, countries, or topics based on a user prompt. It produces clear, factual timelines that save time for educators, researchers, and analysts.
Paid

Statstream is an AI-driven IoT platform for monitoring energy usage, production parameters, and utilities in mid-scale enterprises. It provides real-time data access, customizable reporting, and alerts to optimize energy efficiency and minimize downtime.
Freemium
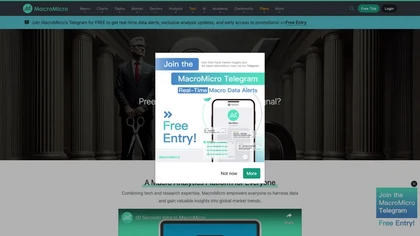
MacroMicro supplies real‑time global macro data, interactive charts, and cycle‑analysis tools for cross‑country comparison (US, China, EU, etc.). It offers recession probability, Hawk‑Dove, and Optimism indices, central‑bank filings, ETF screening, and integration with D&B GlobalView.
Subscription
GanttChart.AI generates full project timelines from plain‑English descriptions, auto‑setting dates, dependencies, and milestones. Users edit tasks, durations, dependencies, assign members in a web editor, and integrate with Google Sheets or export to Excel, CSV, or JSON.
Freemium
ChartFast uses GPT‑4o to clean, normalize, and analyze datasets, then instantly generates customizable charts via natural‑language queries. Exportable to CSV/Excel, it supports Python scripts for large‑scale analysis, streamlining workflows for analysts and non‑technical users.
Subscription
- $9/mo
Simple Analytics delivers privacy‑first web analytics, capturing only non‑personal data. It offers real‑time dashboards, goal and event tracking, AI chat support, encrypted data, and integrations with GTM, WordPress, and visualization tools.
Freemium
- $15/mo

Chronicle converts notes, outlines, meetings or existing decks into complete slide decks with generated slides, charts, diagrams and visuals; offers a freeform editing canvas, brand templates, collaboration and permissions, export options, integrations, and enterprise-grade controls.
Freemium
- $15/mo

AI Infographic Generator converts text and data into customizable graphics like infographics and flowcharts. With over 500 templates and multi-language support, it enables editing and downloading in multiple formats, all while supporting 4K resolution.
Freemium
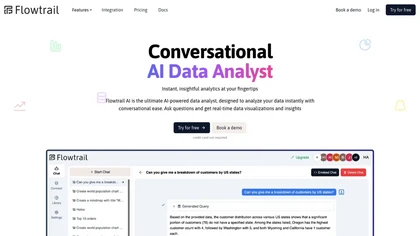
Flowtrail AI lets users ask natural‑language questions across databases, spreadsheets, APIs, and files, generating charts, dashboards, and PDFs without writing code. It offers role‑specific assistants, real‑time alerts, automated report scheduling, and one‑click sharing to Slack, Teams, or WhatsApp.
Free trial
- $1.17/mo

SciDraw AI is a scientific illustration and data visualization tool that converts text prompts, sketches, or images into publication-ready figures. It generates editable SVG/PPTX exports, data-driven charts from CSV/Excel, and supports journal style presets and colorblind-friendly palettes for repro
Free trial
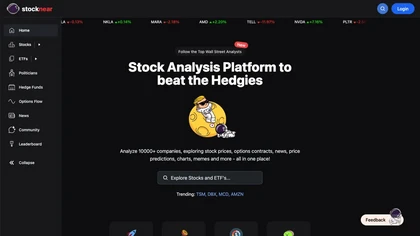
Stocknear delivers real‑time U.S. stock and ETF data—including prices, options flow, dark‑pool activity, and news—alongside customizable dashboards, portfolio tracking, and screening tools for active traders and investors, and live index data—S&P 500, Nasdaq, Dow, Russell—for timely market shift det
Subscription
ChartX automates billing and claim management for elder care, assisted living, and home health. AI‑driven onboarding updates patient records with a single click, encrypts data, supports denial handling, real‑time cloud sync, and delivers analytics for revenue insight across facility sizes.
Paid
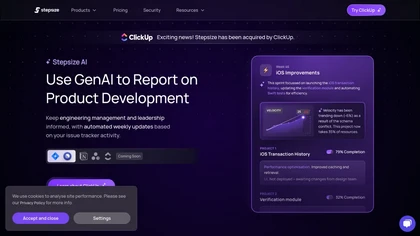
Stepsize AI automates Jira and Linear dashboards, compiling weekly product‑development reports with key metrics, commentary, sprint themes, and technical debt. It offers high‑level overviews, project‑level insights, risk alerts, and actionable suggestions—all with zero manual setup and AES‑256 secur
Subscription
TradeUI offers a platform that merges real‑time flow data with AI sentiment to highlight bullish/bearish trends and unusual premium activity. It provides alerts, an integrated trading bot, news, charts, and AI signals for swing or position strategies.
Paid
- $45/mo

PlotsAlot provides AI-assisted data analysis and visualization, turning CSV/Excel/SPSS/JSON/PDF/image uploads into interactive charts and full-stack dashboards via natural-language queries. Features include conversational data chat, predictive analytics, automated reporting, and reusable dashboards.
Free
- $10/mo