Heatmap Visualization
The best 50 Heatmap Visualization AI tools - Free & Paid
Explore 50 AI for Heatmap Visualization

Pie Chart Maker lets users quickly create pie, doughnut, and 3‑D charts by entering comma‑separated labels and values. Adjust colors, legend placement, and rotation; export to PNG, JPEG, or SVG. Ideal for students, teachers, designers.
Free

vizGPT turns natural‑language queries and drag‑and‑drop into live dashboards and charts, retaining context for follow‑ups. It includes data tables for profiling and transforms, and design tools that generate Lottie JSON and SVG animations, enabling team collaboration.
Paid
- $10/mo

ChartGen.ai is an AI chart generator that converts CSV/Excel data or pasted text into presentation-ready visualizations using plain-English prompts. It supports numerous chart types, offers live data sync, and exports in multiple formats with enterprise-grade security.
Freemium
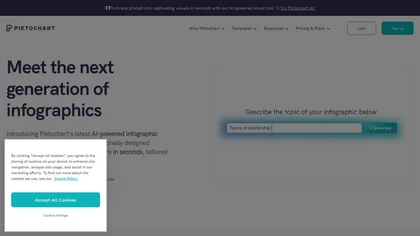
Piktochart is an AI‑powered visual creation platform that turns text into infographics, charts, and videos within seconds. It offers templates, a brand kit, collaborative editing, interactive graphics, and export options for print and digital use.
Freemium

Graphy transforms raw data from Google Sheets, CSV, Excel, or APIs into AI‑generated charts, auto‑highlighting insights. It supports multiple chart types, branding, annotations, real‑time updates, and export/embed options for marketing, finance, and consulting teams.
Freemium
- $16/mo
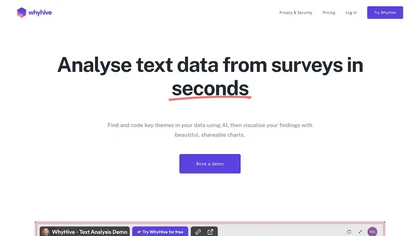
WhyHive transforms CSV/Excel data into visual insights, automatically extracting themes from open‑ended text, tallying occurrences, and generating rule‑based charts. It combines GPT summarisation with data‑faithful charting, enabling rapid dashboards for research, marketing, and impact evaluation.
Freemium
- $29/mo
ChartPixel is an AI tool that generates charts and insights from messy data files or webpages using AI algorithms to clean and engineer new features, provide AI-assisted annotations and statistics to explore patterns and quirks in the data.
Freemium
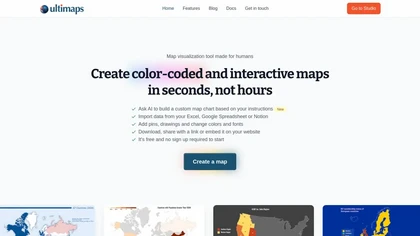
Ultimaps is a user-friendly tool for creating interactive, color-coded maps quickly. It supports data import from various sources and offers features like pins, editable legends, and tooltips, with no sign-up required for basic use.
Freemium
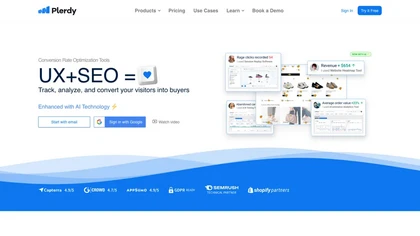
Plerdy visualizes visitor behavior with heatmaps, scrolls, and session replay, spotlights usability problems, and offers pop‑up building, funnel analysis, A/B testing, and SEO checks. AI flags “rage clicks” and links with GA4, Search Console, and Chrome extensions.
Freemium
- $32
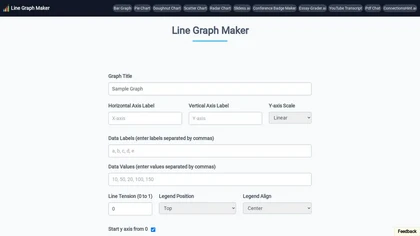
Line Graph Maker lets users input comma‑separated data to produce line charts in PNG, JPG, or SVG. Adjust titles, axis labels, Y‑axis scaling, line tension, legend, grids, colors, and download for reports or presentations.
Free
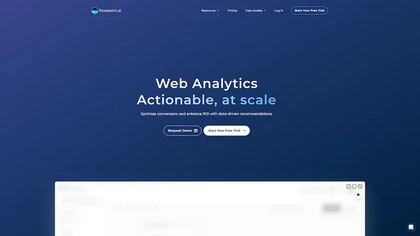
Flowpoint offers a single‑panel dashboard that aggregates key website analytics: top traffic sources, high‑performing pages, real‑time audience by geography, and detailed event timelines. It provides step‑by‑step funnel analysis and session recordings to pinpoint conversion drop‑offs.
Freemium
- $5/mo

ChartAI auto‑creates diverse visualizations—mind maps, flowcharts, timelines, Gantt charts, ER diagrams, etc.—by converting data into polished diagrams. It offers templates, quick start, and dataset generation, aiding analysts, researchers, educators, and managers.
Free

Free AI Graph Maker enables users to create interactive charts and graphs, including bar, pie, and line charts. It supports Gantt charts, flowcharts, and mind maps, facilitating effective data visualization for various sectors like education and finance.
Freemium
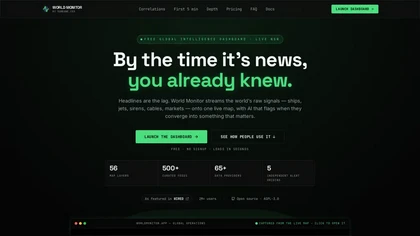
worldmonitor.app is a real-time global intelligence dashboard that overlays live signals from 500+ feeds and 65+ data providers onto an interactive map. It correlates geopolitical events, infrastructure outages, and sensor alerts with market movements for analysts, traders, and risk managers.
Freemium

PlotsAlot provides AI-assisted data analysis and visualization, turning CSV/Excel/SPSS/JSON/PDF/image uploads into interactive charts and full-stack dashboards via natural-language queries. Features include conversational data chat, predictive analytics, automated reporting, and reusable dashboards.
Free
- $10/mo
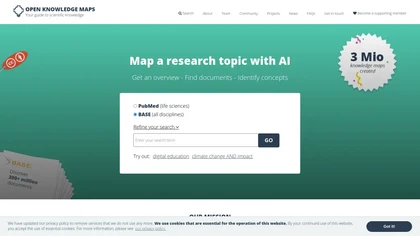
Open Knowledge Maps is an AI search engine that visualizes scientific literature across disciplines, clustering related papers to reveal topic connections and trends. It supports varied document types, offers high‑quality metadata, multilingual browsing, and open‑source integration.
Freemium
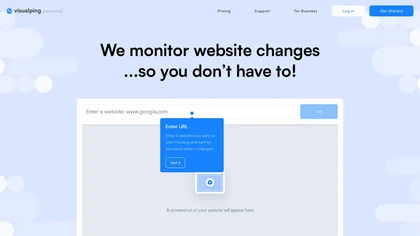
Visualping monitors website changes—visual, textual, or code—in real time, sending alerts via email, Teams, Slack, webhooks, or API. It provides before‑and‑after screenshots, AI‑highlighted significant changes, and easy browser integration for individuals and teams.
Freemium
- $10/mo

ChartGPT is an AI tool that facilitates easy creation and customization of multiple chart types for enhanced data visualization. It provides versatility in displaying data through various charts, ensuring clear and captivating presentations for diverse projects.
Freemium
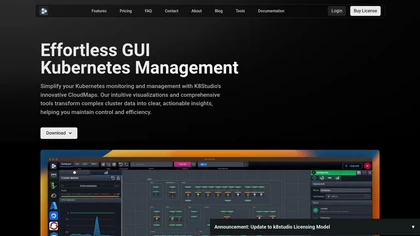
K8Studio is a client‑side Kubernetes GUI that connects directly to cluster APIs, providing real‑time topology maps, AI‑assisted YAML editing, a unified security dashboard, multi‑cluster management, built‑in terminal execution, and no data collection for compliance.
Subscription
- $9/mo

Grapha.ai is an AI-enabled data exploration tool that swiftly reveals hidden trends and provides intuitive visualizations & insights from complex datasets without requiring any coding knowledge.
Subscription
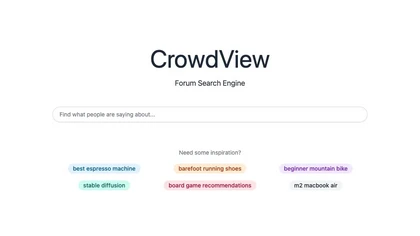
CrowdView is a platform that allows users to view and share real-time video feeds from events around the world.
Tableau AI is an intelligent analytics platform that combines AI technologies for enhanced data exploration and decision-making. It offers scalable solutions, trusted by organizations, to boost data-driven insights and promote innovative cultures.
Free trial
- $15
Splotch is a free AI flowchart generator that converts textual workflows into interactive diagrams, facilitating easy visualization, collaboration, and communication for teams in various fields, including product management, marketing, and e-commerce.
Free trial
Bricks AI transforms CSV, Excel, Google Sheets, and database files into instant interactive dashboards and reports. It auto‑creates charts, lets users edit data via natural‑language commands, refreshes with one click, and offers reusable templates with encrypted privacy.
Freemium
- $25/mo

ChatCSV lets users upload CSV files from computer, URL, or clipboard and query data with natural language. It auto‑generates common questions and returns charted answers (bar, pie, custom). Interactions are saved, shareable, used for team collaboration across retail, finance, marketing.
Free

SciDraw AI is a scientific illustration and data visualization tool that converts text prompts, sketches, or images into publication-ready figures. It generates editable SVG/PPTX exports, data-driven charts from CSV/Excel, and supports journal style presets and colorblind-friendly palettes for repro
Free trial
Kanaries transforms raw data into interactive visual insights with AI‑assisted code completion for Pandas, RStudio, and Jupyter. Drag‑and‑drop chart building, natural‑language chat, real‑time collaboration, and offline desktop support streamline the entire exploration workflow across web and desktop
Subscription
Infografix leverages Azure AI to turn text prompts into infographics—timelines, mind maps, SWOT analyses, family trees, and more—using templates, over 1,500 Google Fonts, and direct canvas editing. Export to PNG, JPG, SVG, PDF and share on social media.
Free

Julius AI is a data analyst assistant that connects to Excel, Google Sheets, and PostgreSQL to generate bar charts, histograms, heat maps automatically. It offers interactive, customizable visualizations, embeddable into reports, and exports cleaned data for stakeholders.
Freemium
Supadash lets users connect to SQL databases like PostgreSQL or Supabase and automatically turns SELECT results into time‑series and bar charts without manual coding. It supports unlimited charts per project, offers AI‑generated layouts, and stores no user data.
Subscription
- $7/mo
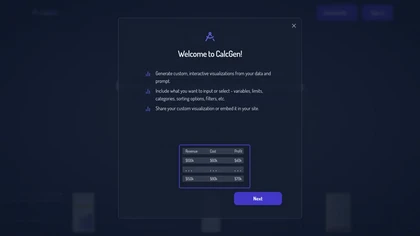
Calcgen AI enables users to create custom interactive charts, graphs, and calculators for data visualization. It includes tools for financial analysis, scientific calculations, and educational purposes, catering to a broad range of professional needs.
Subscription
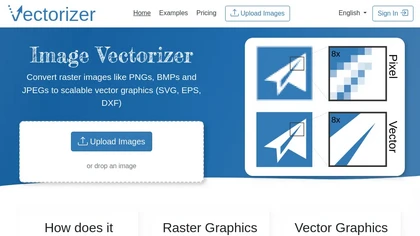
Image Vectorizer transforms raster PNG, BMP, JPEG files into scalable vector formats (SVG, EPS, DXF) using AI noise removal and color simplification. It sharpens edges, converts pixels to geometric primitives, and outputs high‑resolution vectors for logos, apparel, tattoos, and billboards.
Subscription
- $8.99/mo

VisualizeAI transforms sketches, photos, or images into high‑quality renders within seconds. Users choose style, color, and theme from over 100 presets or custom options, supporting architecture, interior, product design, and hobby projects for rapid ideation.
Subscription
- $17/mo
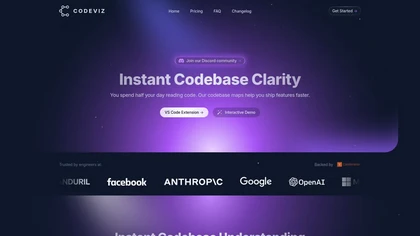
CodeViz automatically scans codebases in major languages to generate editable, versioned architecture diagrams. Teams view end‑to‑end workflows, API routes, and data flows, embed them in Git, Jira, Slack, or Figma, and sync branch‑specific designs for faster reviews and deployments.
Freemium
- $19/mo
Textomap turns text, images, links, and CSVs into interactive maps instantly. It extracts coordinates, supports 28 languages, and lets users embed maps on blogs, export CSVs, or link to Google Maps, with real‑time updates across devices.
Freemium
- $8/mo
FiftyOne is a visual AI platform that centralizes data curation, annotation, and model evaluation across images, video, point clouds, and metadata. It offers interactive slicing, automatic labeling with confidence scoring, role‑based access, versioning, and open‑source integration.
Free
Quadratic is an AI‑enabled spreadsheet that connects to CSV, Excel, PDFs, and databases like Postgres and Snowflake. It lets users filter, clean, and analyze data in a grid, ask natural‑language queries, and generate editable Python and SQL code for visualizations.
Subscription
Globe Explorer is an AI-driven platform for data analysis and trend identification, offering robust topic discovery, visual data representations, insightful reports, and collaborative features to enhance research for educators, researchers, and content creators.
Freemium
Color Wheel automatically colorizes grayscale flat graphics, generating thousands of palettes from one upload. Users tweak schemes and preview styles from Warhol to NES, saving locally with no registration for web and UI projects.
Free
MyMap turns text prompts into mind maps, flowcharts, SWOT, timelines, and database schemas on an infinite canvas. It auto‑generates and places nodes with real‑time AI context awareness, letting users drag, connect, and reorganize for brainstorming and planning.
Freemium
- $12/mo

WatchTower visualizes provisional DynamoDB capacities with real‑time dashboards, searchable data, and historical retrieval. Integrated with Amazon Bedrock, it offers predictive trend analysis to inform capacity planning, helping developers, DevOps engineers, and data architects optimize performance
Freemium
Hex unifies notebooks, conversational queries, and dashboards in a single workspace. It uses shared semantic context to offer reliable insights from Snowflake, BigQuery, Redshift, and more. Data scientists write code, while business users ask plain‑language questions via Threads or Slack.
Freemium
- $36/mo
Datviz AI is a data visualization tool that leverages OpenAI's language model to analyze complex datasets and generate insightful charts. It offers an intuitive interface for creating diverse visualizations like bar charts, heatmaps, and geomaps to support data-driven decisions.
Freemium

Visualizee.ai turns plain‑language descriptions into photorealistic 2K/4K renders and motion videos for architects, designers, and developers. Its conversational AI, multi‑language support, and context‑aware geometry enable quick lighting, material, and batch image transformations.
Freemium
- $15/mo

Lava Metrics syncs automatically with HubSpot to deliver real‑time, unified pipeline reports. It tracks deal velocity, sales cycle length, conversion rates, and cohort studies, and lets teams set and monitor monthly revenue targets for data‑driven decision making.
Freemium
- $25

paper-banana.ai is an AI tool that automates the creation of publication-ready scientific figures from text and data. It generates accurate, reproducible diagrams and plots with downloadable code, formatted for academic papers and presentations.
Subscription
- $6.99/mo