Interactive Statistical Plots
The best 50 Interactive Statistical Plots AI tools - Free & Paid
Explore 50 AI for Interactive Statistical Plots

SciDraw AI is a scientific illustration and data visualization tool that converts text prompts, sketches, or images into publication-ready figures. It generates editable SVG/PPTX exports, data-driven charts from CSV/Excel, and supports journal style presets and colorblind-friendly palettes for repro
Free trial

PlotsAlot provides AI-assisted data analysis and visualization, turning CSV/Excel/SPSS/JSON/PDF/image uploads into interactive charts and full-stack dashboards via natural-language queries. Features include conversational data chat, predictive analytics, automated reporting, and reusable dashboards.
Free
- $10/mo
Piktochart is an AI‑powered visual creation platform that turns text into infographics, charts, and videos within seconds. It offers templates, a brand kit, collaborative editing, interactive graphics, and export options for print and digital use.
Freemium
Kanaries transforms raw data into interactive visual insights with AI‑assisted code completion for Pandas, RStudio, and Jupyter. Drag‑and‑drop chart building, natural‑language chat, real‑time collaboration, and offline desktop support streamline the entire exploration workflow across web and desktop
Subscription

vizGPT turns natural‑language queries and drag‑and‑drop into live dashboards and charts, retaining context for follow‑ups. It includes data tables for profiling and transforms, and design tools that generate Lottie JSON and SVG animations, enabling team collaboration.
Paid
- $10/mo

Free AI Graph Maker enables users to create interactive charts and graphs, including bar, pie, and line charts. It supports Gantt charts, flowcharts, and mind maps, facilitating effective data visualization for various sectors like education and finance.
Freemium
Quadratic is an AI‑enabled spreadsheet that connects to CSV, Excel, PDFs, and databases like Postgres and Snowflake. It lets users filter, clean, and analyze data in a grid, ask natural‑language queries, and generate editable Python and SQL code for visualizations.
Subscription

Graphy transforms raw data from Google Sheets, CSV, Excel, or APIs into AI‑generated charts, auto‑highlighting insights. It supports multiple chart types, branding, annotations, real‑time updates, and export/embed options for marketing, finance, and consulting teams.
Freemium
- $16/mo

Pie Chart Maker lets users quickly create pie, doughnut, and 3‑D charts by entering comma‑separated labels and values. Adjust colors, legend placement, and rotation; export to PNG, JPEG, or SVG. Ideal for students, teachers, designers.
Free
Calcgen AI enables users to create custom interactive charts, graphs, and calculators for data visualization. It includes tools for financial analysis, scientific calculations, and educational purposes, catering to a broad range of professional needs.
Subscription


AhaSlides is an interactive presentation platform for live polls, quizzes, word clouds, surveys and spinner wheels, enabling real-time audience engagement, anonymous responses, leaderboards and scorekeeping, with templates, reporting, analytics and integrations for classroom and corporate sessions.
Freemium
The StoryGraph is an AI-powered reading platform utilizing machine learning. It offers personalized book recommendations, stats tracking, customizable selections, mood/theme filters, live reactions, reading challenges, and content warnings for an immersive reading experience.
Free

paper-banana.ai is an AI tool that automates the creation of publication-ready scientific figures from text and data. It generates accurate, reproducible diagrams and plots with downloadable code, formatted for academic papers and presentations.
Subscription
- $6.99/mo
Plot is a creative hub for social media teams, offering content planning, storage, and sourcing. It includes an AI video listening tool, a content calendar, and trend discovery features to enhance collaboration and optimize engagement.
Free trial
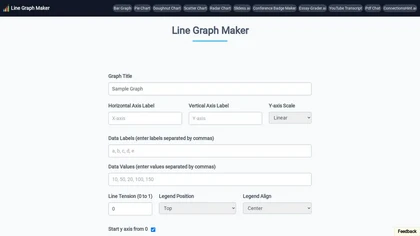
Line Graph Maker lets users input comma‑separated data to produce line charts in PNG, JPG, or SVG. Adjust titles, axis labels, Y‑axis scaling, line tension, legend, grids, colors, and download for reports or presentations.
Free

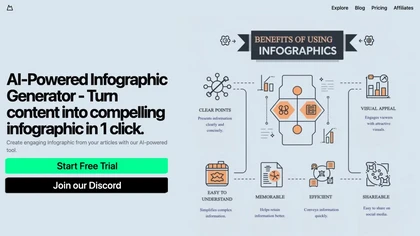
AI Infographic Generator converts text and data into customizable graphics like infographics and flowcharts. With over 500 templates and multi-language support, it enables editing and downloading in multiple formats, all while supporting 4K resolution.
Freemium

ChartGen.ai is an AI chart generator that converts CSV/Excel data or pasted text into presentation-ready visualizations using plain-English prompts. It supports numerous chart types, offers live data sync, and exports in multiple formats with enterprise-grade security.
Freemium
Ultimaps is a user-friendly tool for creating interactive, color-coded maps quickly. It supports data import from various sources and offers features like pins, editable legends, and tooltips, with no sign-up required for basic use.
Freemium
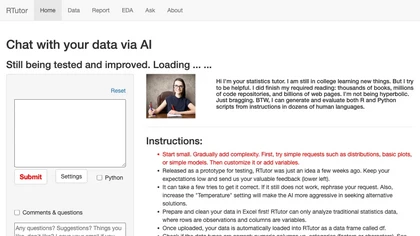
RTutor converts natural‑language prompts into R or Python code for exploratory data analysis. Upload CSV/TSV/Excel, auto‑load into df/df2, generate statistics, plots, and an interactive HTML report, with session context and data privacy.
Subscription

ChartAI auto‑creates diverse visualizations—mind maps, flowcharts, timelines, Gantt charts, ER diagrams, etc.—by converting data into polished diagrams. It offers templates, quick start, and dataset generation, aiding analysts, researchers, educators, and managers.
Free

ChartGPT is an AI tool that facilitates easy creation and customization of multiple chart types for enhanced data visualization. It provides versatility in displaying data through various charts, ensuring clear and captivating presentations for diverse projects.
Freemium
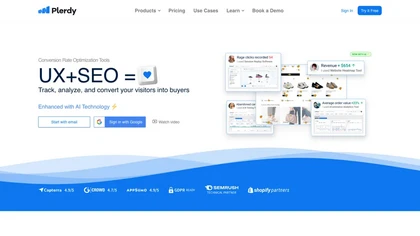
Plerdy visualizes visitor behavior with heatmaps, scrolls, and session replay, spotlights usability problems, and offers pop‑up building, funnel analysis, A/B testing, and SEO checks. AI flags “rage clicks” and links with GA4, Search Console, and Chrome extensions.
Freemium
- $32
ChartPixel is an AI tool that generates charts and insights from messy data files or webpages using AI algorithms to clean and engineer new features, provide AI-assisted annotations and statistics to explore patterns and quirks in the data.
Freemium
AI Infographics converts text into customizable visuals, such as roadmaps and timelines, enhancing data presentation for reports and presentations. Its intuitive interface streamlines the creation process, allowing users to download in formats like PNG and SVG for easy sharing.
Free trial
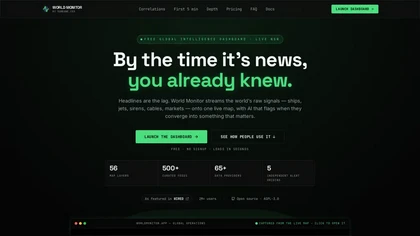
worldmonitor.app is a real-time global intelligence dashboard that overlays live signals from 500+ feeds and 65+ data providers onto an interactive map. It correlates geopolitical events, infrastructure outages, and sensor alerts with market movements for analysts, traders, and risk managers.
Freemium
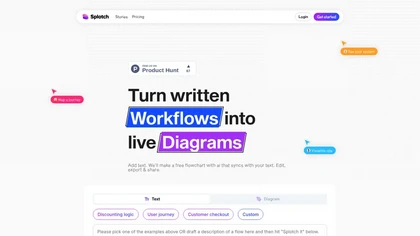
Splotch is a free AI flowchart generator that converts textual workflows into interactive diagrams, facilitating easy visualization, collaboration, and communication for teams in various fields, including product management, marketing, and e-commerce.
Free trial
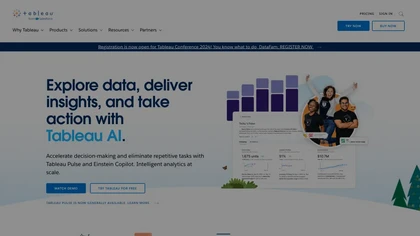
Tableau AI is an intelligent analytics platform that combines AI technologies for enhanced data exploration and decision-making. It offers scalable solutions, trusted by organizations, to boost data-driven insights and promote innovative cultures.
Free trial
- $15

MakeInfographic.ai converts text prompts into structured infographics using templates (timelines, comparisons, processes, etc.), selectable visual styles and aspect ratios, exports channel-specific variations for social, presentations, and educational materials with inline editing.
Free trial
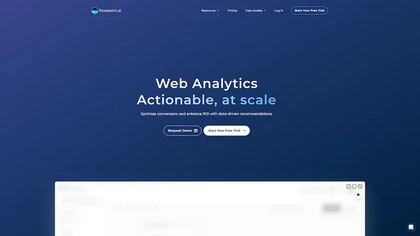
Flowpoint offers a single‑panel dashboard that aggregates key website analytics: top traffic sources, high‑performing pages, real‑time audience by geography, and detailed event timelines. It provides step‑by‑step funnel analysis and session recordings to pinpoint conversion drop‑offs.
Freemium
- $5/mo
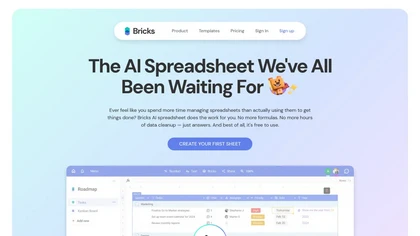
Bricks AI transforms CSV, Excel, Google Sheets, and database files into instant interactive dashboards and reports. It auto‑creates charts, lets users edit data via natural‑language commands, refreshes with one click, and offers reusable templates with encrypted privacy.
Freemium
- $25/mo

Grapha.ai is an AI-enabled data exploration tool that swiftly reveals hidden trends and provides intuitive visualizations & insights from complex datasets without requiring any coding knowledge.
Subscription
Transforms raw data into instant infographics with a single AI‑click workflow. Auto‑generates captions, offers full editing of text, images, colors, and real‑time online search. Ideal for designers, marketers, educators, and social media managers.
Freemium
- $9.99/mo
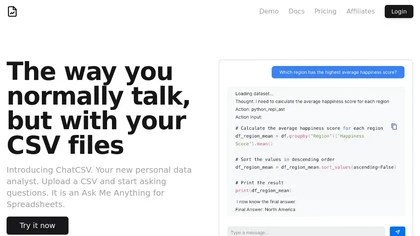
ChatCSV lets users upload CSV files from computer, URL, or clipboard and query data with natural language. It auto‑generates common questions and returns charted answers (bar, pie, custom). Interactions are saved, shareable, used for team collaboration across retail, finance, marketing.
Free

Julius AI is a data analyst assistant that connects to Excel, Google Sheets, and PostgreSQL to generate bar charts, histograms, heat maps automatically. It offers interactive, customizable visualizations, embeddable into reports, and exports cleaned data for stakeholders.
Freemium
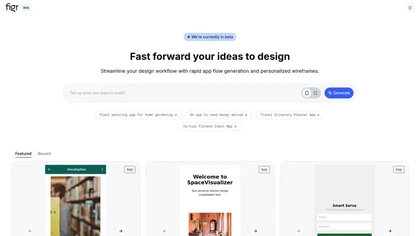
Figr AI is an AI‑driven design platform that generates high‑fidelity mobile and web screens, landing pages, and prototypes in one environment. It uses a memory engine for product intelligence, supports PRD drafting, benchmark research, and design system token management.
Freemium

Plot Party is an AI storyboard and video-creation tool that transforms text prompts into visualized scenes and multi-episode series. It generates consistent storyboards with reusable assets, integrated voice synthesis, and built-in editing for streamlined narrative production.
Freemium
- $29/mo
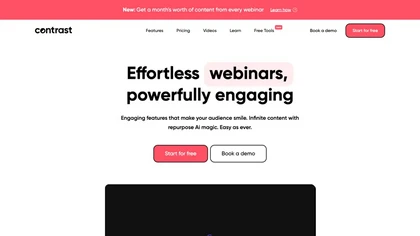
Contrast allows users to quickly create and host live or pre‑recorded webinars with branded pages, interactive widgets, and local FullHD recording. HubSpot integration syncs attendee data, while AI repurposes sessions into posts, clips, or subtitles, feeding engagement metrics to the CRM.
Free
Presentation Intelligence is an AI-powered tool that transforms notes, PDFs, and multimedia into polished presentations with smart design recommendations. It offers cross-platform support, responsive visuals, and themes for professionals and creatives.
Free trial
SyncSketch is a cloud-based collaboration tool for visual effects and gaming professionals, enabling remote teams to review media efficiently with synchronized presentations, frame-accurate annotations, version comparisons, and mobile access, while integrating with platforms like Jira and ShotGrid.
Free trial
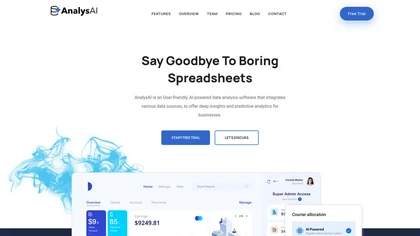
AnalysAI is an AI-driven data analytics platform that integrates data from multiple sources, providing predictive analytics, enhanced customer insights, and interactive dashboards to streamline data analysis and support informed decision-making.
Free trial

Lotto Chart uses machine learning to analyze historical lottery data and generate seven predictive models for U.S. state and multi‑state games like Powerball and Mega Millions. Daily updates and analytics reports help users compare performance and identify statistically robust combinations.
Freemium
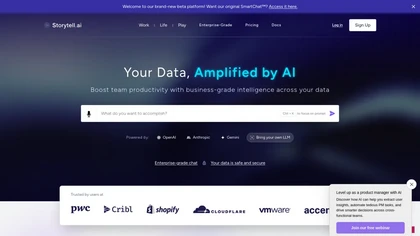
Storytell.ai converts messy data into clear narratives using 945 prompts. It accepts files, images, audio, URLs and augments insights with news, social media, and research. Ideal for data scientists, marketers, analysts, it complies with SOC2, GDPR, and HIPAA.
Freemium
- $20/mo
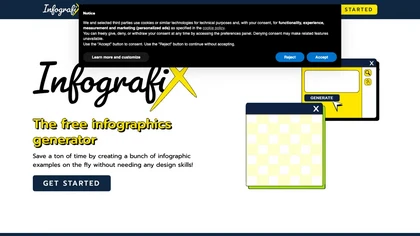
Infografix leverages Azure AI to turn text prompts into infographics—timelines, mind maps, SWOT analyses, family trees, and more—using templates, over 1,500 Google Fonts, and direct canvas editing. Export to PNG, JPG, SVG, PDF and share on social media.
Free


Paper Banana is an AI tool that generates publication-ready academic illustrations from text and sketches. It produces accurate scientific diagrams, statistical charts with executable Python code, and editable assets for papers and presentations.
Subscription
- $13.5/mo

InfographAI converts text, URLs, PDFs, Word docs, and spreadsheets into AI-generated infographics. It extracts key points, auto-places charts and visuals, offers customizable templates and a drag-and-drop editor, and exports PNG or PDF for reports and social media.
Freemium