Top 29 Easy Charts Alternatives in 2026
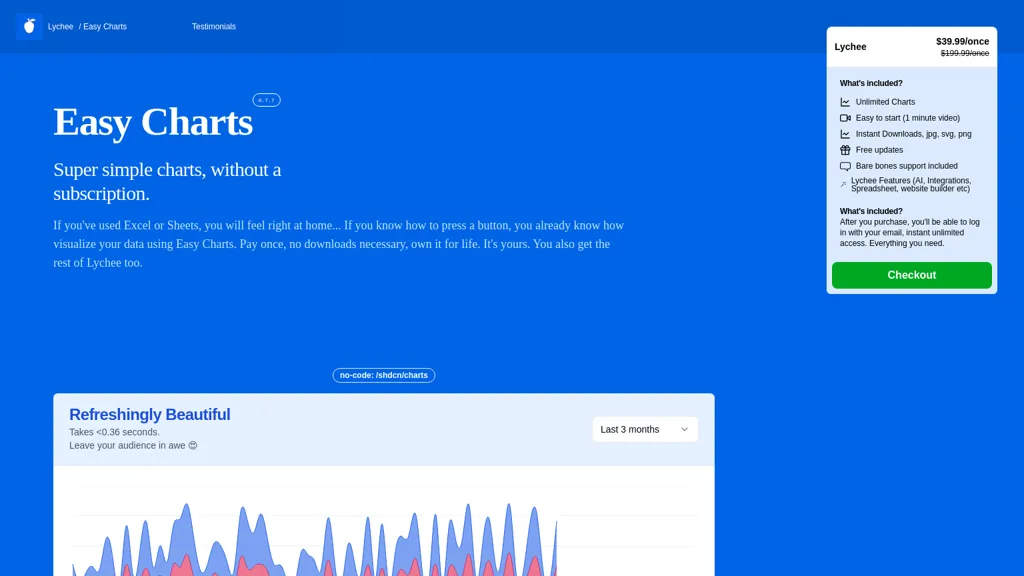
25% positive · 4 user reviews PaidEasy Charts is an AI-powered tool for data visualizations and charts generation without the need for downloads. It offers unlimited chart generation, easy exports, and customization options, making charting effortless for all user levels.
We've ranked 29 Easy Charts alternatives, including 26 with a free plan. Rankings are based on feature coverage and user feedbacks.
Top-rated alternatives include AI graph maker, ChartAI, and Graphy.app.
29 Easy Charts Alternatives & Competitors, Ranked by User Reviews
Click Compare on any tool to compare it side-by-side with Easy Charts.
 #1
AI graph maker
#1
AI graph maker
Free AI Graph Maker enables users to create interactive charts and graphs, including bar, pie, and line charts. It supports Gantt charts, flowcharts, and mind maps, facilitating effective data visualization for various sectors like education and finance.
 #2
ChartAI
#2
ChartAI
ChartAI auto‑creates diverse visualizations—mind maps, flowcharts, timelines, Gantt charts, ER diagrams, etc.—by converting data into polished diagrams. It offers templates, quick start, and dataset generation, aiding analysts, researchers, educators, and managers.
 #3
Graphy.app
#3
Graphy.app
Graphy transforms raw data from Google Sheets, CSV, Excel, or APIs into AI‑generated charts, auto‑highlighting insights. It supports multiple chart types, branding, annotations, real‑time updates, and export/embed options for marketing, finance, and consulting teams.
 #4
AI Infographic Generator
#4
AI Infographic Generator
InfographAI converts text, URLs, PDFs, Word docs, and spreadsheets into AI-generated infographics. It extracts key points, auto-places charts and visuals, offers customizable templates and a drag-and-drop editor, and exports PNG or PDF for reports and social media.
 #5
Piktochart
#5
Piktochart
Piktochart is an AI‑powered visual creation platform that turns text into infographics, charts, and videos within seconds. It offers templates, a brand kit, collaborative editing, interactive graphics, and export options for print and digital use.
 #6
Infograph.app
#6
Infograph.app
AI Infographic Generator converts text and data into customizable graphics like infographics and flowcharts. With over 500 templates and multi-language support, it enables editing and downloading in multiple formats, all while supporting 4K resolution.
- Catch deals before they expire
- Unlock tools matched to you
- Show off your AI stacks
Already a member? Sign in
 #7
ChartPixel
#7
ChartPixel
ChartPixel is an AI tool that generates charts and insights from messy data files or webpages using AI algorithms to clean and engineer new features, provide AI-assisted annotations and statistics to explore patterns and quirks in the data.
 #8
AI Infographics
#8
AI Infographics
AI Infographics converts text into customizable visuals, such as roadmaps and timelines, enhancing data presentation for reports and presentations. Its intuitive interface streamlines the creation process, allowing users to download in formats like PNG and SVG for easy sharing.
 #9
Make Infographic AI
#9
Make Infographic AI
MakeInfographic.ai converts text prompts into structured infographics using templates (timelines, comparisons, processes, etc.), selectable visual styles and aspect ratios, exports channel-specific variations for social, presentations, and educational materials with inline editing.
 #10
SciDraw AI
#10
SciDraw AI
SciDraw AI is a scientific illustration and data visualization tool that converts text prompts, sketches, or images into publication-ready figures. It generates editable SVG/PPTX exports, data-driven charts from CSV/Excel, and supports journal style presets and colorblind-friendly palettes for reproducible graphics.
 #11
VDraw AI
#11
VDraw AI
vdraw is an AI tool that transforms text and multimedia into customizable infographics and graphics. It simplifies data visualization, allowing users to create engaging visuals for various platforms without requiring advanced design skills.
 #12
Excel Dashboard Ai
#12
Excel Dashboard Ai
ExcelDashboard AI transforms Excel data into interactive dashboards and reports with minimal effort. Users can generate insights using plain English, automate visualizations, and customize analyses, making it suitable for both beginners and experienced data analysts.
 #13
Canva AI
#13
Canva AI
Canva's AI Image Generators turns text into visuals with customizable art styles and features like Magic Media, Create an Image, and automated reviews.
 #14
PresentationsAI
#14
PresentationsAI
Presentations.AI automatically turns text prompts into fully formatted slide decks, including charts, infographics, timelines, and roadmaps. It applies consistent branding, exports to PowerPoint, supports multilingual collaboration, and offers engagement analytics for content refinement.
 #15
Equals
#15
Equals
AI Assist is a powerful AI-powered data analysis tool that offers features such as real-time collaboration, formula generation, SQL writing, visual charting, and integrations with popular platforms.
 #16
Ainfographic
#16
Ainfographic
Ainfographic simplifies infographic creation by converting text into visual formats using AI. Users can upload documents or paste URLs, choosing from various templates and aspect ratios for high-quality, print-ready visuals tailored for social media.
 #17
Grapha AI
#17
Grapha AI
Grapha.ai is an AI-enabled data exploration tool that swiftly reveals hidden trends and provides intuitive visualizations & insights from complex datasets without requiring any coding knowledge.
 #18
Aijourney
#18
Aijourney
Julius AI is a data analyst assistant that connects to Excel, Google Sheets, and PostgreSQL to generate bar charts, histograms, heat maps automatically. It offers interactive, customizable visualizations, embeddable into reports, and exports cleaned data for stakeholders.
 #19
aiflowchart
#19
aiflowchart
AI Flowchart is a diagram generation tool that creates various visual formats, such as flowcharts and pie charts, from different data sources. It offers customization options and an iterative recreation feature for enhanced diagram design efficiency.
 #20
Napkin.ai
#20
Napkin.ai
Napkin AI automatically converts pasted or uploaded text into diagrams, charts, flowcharts, and mind maps. Users can customize icons, styles, connectors, and colors, then export to PPT, PNG, PDF or SVG. It supports 60+ languages and real‑time collaboration.
Tableau AI is an intelligent analytics platform that combines AI technologies for enhanced data exploration and decision-making. It offers scalable solutions, trusted by organizations, to boost data-driven insights and promote innovative cultures.
 #22
Graphicinfo
#22
Graphicinfo
Transforms raw data into instant infographics with a single AI‑click workflow. Auto‑generates captions, offers full editing of text, images, colors, and real‑time online search. Ideal for designers, marketers, educators, and social media managers.
 #23
Infography
#23
Infography
Infographic AI tool automatically creates engaging infographics from blog content. Suitable for marketers, educators, and influencers, it simplifies complex data, enhances content engagement, and boosts social media reach through shareable visuals.
 #24
Bricks
#24
Bricks
Bricks AI transforms CSV, Excel, Google Sheets, and database files into instant interactive dashboards and reports. It auto‑creates charts, lets users edit data via natural‑language commands, refreshes with one click, and offers reusable templates with encrypted privacy.
 #25
CalcGen AI
#25
CalcGen AI
Calcgen AI enables users to create custom interactive charts, graphs, and calculators for data visualization. It includes tools for financial analysis, scientific calculations, and educational purposes, catering to a broad range of professional needs.
 #26
Pictorial
#26
Pictorial
The AI tool generates professional and diverse graphics for blogs and other messaging needs using AI.
 #27
AI Presentation Maker
#27
AI Presentation Maker
AI Presentation Maker is an online tool that uses generative AI to create professional presentations in three simple steps: input topic, define audience, and outline goals. It offers customizable themes, templates, and stock images, with the ability to refine presentations in PowerPoint or Google Slides.
 #28
edraw ai
#28
edraw ai
Edraw.ai is an AI-driven platform for visual collaboration, offering a variety of diagram types and real-time editing. It enhances productivity by facilitating teamwork, streamlining workflows, and improving visual documentation across diverse industries.
 #29
Excelmatic
#29
Excelmatic
Excelmatic uses AI to analyze and visualize spreadsheet data via natural-language queries, offering one-click charting, KPI extraction, anomaly detection, PDF/image-to-Excel conversion, formula generation from plain English, and batch data-prep for .xlsx/.csv files.
Frequently Asked Questions
Why look for Easy Charts alternatives?
Common reasons users switch from Easy Charts:
- Cost: Easy Charts is a Paid tool starting from $39.99 — users often look for more affordable or free options.
- User satisfaction: Easy Charts holds a 25% positive rating — some users report unmet expectations.
- Feature gaps: teams needing specific capabilities like Generate charts may find a more focused alternative better suited to their workflow.
- Flexibility: exploring alternatives helps find tools that better match your team size, integrations, and budget.
What is the best alternative to Easy Charts?
Based on 1 user review, AI graph maker (50% positive) ranks as the top Easy Charts alternative. Free AI Graph Maker enables users to create interactive charts and graphs, including bar, pie, and line charts. It supports Gantt charts, flowcharts, It is available on a Freemium plan.
How do the top Easy Charts alternatives compare?
| Tool | Pricing | Starting Price | User Rating |
|---|---|---|---|
| Easy Charts this tool | Paid | $39.99 | 25% (4) |
| AI graph maker | Freemium | — | 50% (1) |
| ChartAI | Free | — | 50% (2) |
| Graphy.app | Freemium | $16/mo | — |
| AI Infographic Generator | Freemium | — | — |
| Piktochart | Freemium | — | 80% (20) |
Are there free Easy Charts alternatives?
Yes, 26 free alternatives found in our list: AI graph maker, ChartAI, Graphy.app. and 23 more — use the pricing filter above to see them all.
What should I look for in a Easy Charts alternative?
- Core capabilities: confirm the tool supports Generate charts, Export images, Customize charts.
- Pricing transparency: look for clear free plan, trial period, or tiered pricing — avoid tools that hide costs.
- User reviews: check both the satisfaction percentage and the number of reviews; a high score from few users is less reliable.
- Integrations: verify it connects with your existing stack before committing.
- Support and updates: active development and responsive support are strong signals of a maintained product.
Which Easy Charts alternative has the highest user rating?
ChartPixel has the highest satisfaction score among Easy Charts alternatives, with 100% positive from 5 user reviews. It is available on a Freemium plan.
What are Easy Charts alternatives used for?
- Generate charts
- Export images
- Customize charts
- Create visualizations
- Generate graphics