Visualization Dashboard
The best 50 Visualization Dashboard AI tools - Free & Paid
Explore 50 AI for Visualization Dashboard

ExcelDashboard AI transforms Excel data into interactive dashboards and reports with minimal effort. Users can generate insights using plain English, automate visualizations, and customize analyses, making it suitable for both beginners and experienced data analysts.
Free trial
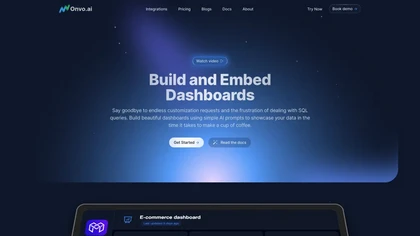
Onvo AI revolutionizes data visualization through AI prompts, enabling users to easily generate tailored charts and dashboards without intricate queries. It ensures secure sharing, supports multiple data source integrations, and provides SDKs for smooth product incorporation.
Free trial
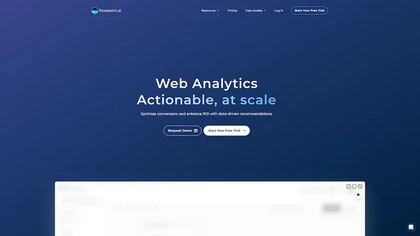
Flowpoint offers a single‑panel dashboard that aggregates key website analytics: top traffic sources, high‑performing pages, real‑time audience by geography, and detailed event timelines. It provides step‑by‑step funnel analysis and session recordings to pinpoint conversion drop‑offs.
Freemium
- $5/mo
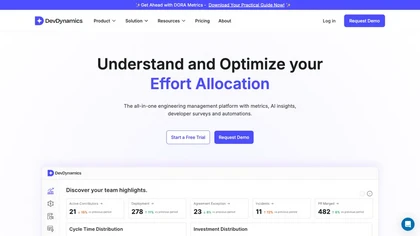
DevDynamics offers real‑time engineering analytics, tracking DORA metrics, forecasting delivery, and aligning output with business goals. It integrates with 20+ tools, provides custom reports, and meets SOC 2 Type II security standards.
Freemium

No-Code KPI Dashboard AI by Sqor Value enables users to create customizable KPI dashboards without coding, offering drag-and-drop functionality and integration with various data sources for real-time performance monitoring and strategic planning.
Freemium

vizGPT turns natural‑language queries and drag‑and‑drop into live dashboards and charts, retaining context for follow‑ups. It includes data tables for profiling and transforms, and design tools that generate Lottie JSON and SVG animations, enabling team collaboration.
Paid
- $10/mo

Xdash AI offers seamless data analysis, in-depth reporting, and task automation. It excels at uncovering crucial insights from intricate datasets, facilitating informed business decisions.
Freemium
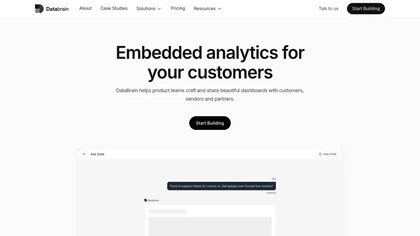
DataBrain is an embedded analytics platform that gives product teams and developers interactive dashboards, self‑service reporting, and AI‑powered insights. Its low‑code interface and SDK let users customize visualizations, connect to multiple data sources, and embed analytics into applications.
Subscription
- $999/mo
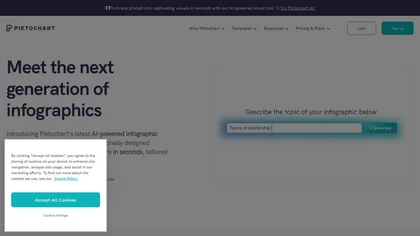
Piktochart is an AI‑powered visual creation platform that turns text into infographics, charts, and videos within seconds. It offers templates, a brand kit, collaborative editing, interactive graphics, and export options for print and digital use.
Freemium
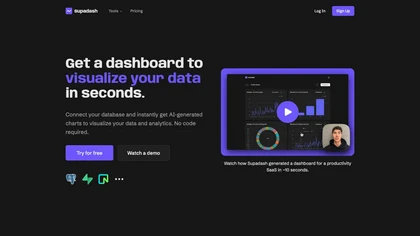
Supadash lets users connect to SQL databases like PostgreSQL or Supabase and automatically turns SELECT results into time‑series and bar charts without manual coding. It supports unlimited charts per project, offers AI‑generated layouts, and stores no user data.
Subscription
- $7/mo

Plandek aggregates issue tracker, repo, CI/CD, and monitoring data to give real‑time delivery insights. It offers dashboards for DORA, flow, productivity, custom metrics, AI summaries, and GenAI impact tracking to improve velocity, quality, and resource alignment.
Freemium
- $59/mo

Grapha.ai is an AI-enabled data exploration tool that swiftly reveals hidden trends and provides intuitive visualizations & insights from complex datasets without requiring any coding knowledge.
Subscription

Graphy transforms raw data from Google Sheets, CSV, Excel, or APIs into AI‑generated charts, auto‑highlighting insights. It supports multiple chart types, branding, annotations, real‑time updates, and export/embed options for marketing, finance, and consulting teams.
Freemium
- $16/mo
ChartPixel is an AI tool that generates charts and insights from messy data files or webpages using AI algorithms to clean and engineer new features, provide AI-assisted annotations and statistics to explore patterns and quirks in the data.
Freemium
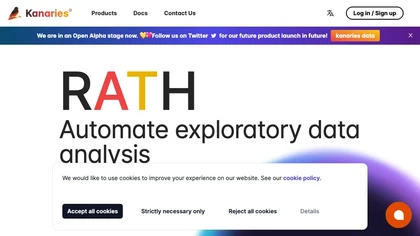
Kanaries transforms raw data into interactive visual insights with AI‑assisted code completion for Pandas, RStudio, and Jupyter. Drag‑and‑drop chart building, natural‑language chat, real‑time collaboration, and offline desktop support streamline the entire exploration workflow across web and desktop
Subscription

ChartAI auto‑creates diverse visualizations—mind maps, flowcharts, timelines, Gantt charts, ER diagrams, etc.—by converting data into polished diagrams. It offers templates, quick start, and dataset generation, aiding analysts, researchers, educators, and managers.
Free

ChartGen.ai is an AI chart generator that converts CSV/Excel data or pasted text into presentation-ready visualizations using plain-English prompts. It supports numerous chart types, offers live data sync, and exports in multiple formats with enterprise-grade security.
Freemium
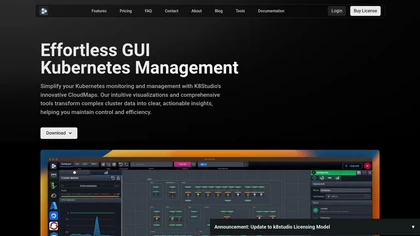
K8Studio is a client‑side Kubernetes GUI that connects directly to cluster APIs, providing real‑time topology maps, AI‑assisted YAML editing, a unified security dashboard, multi‑cluster management, built‑in terminal execution, and no data collection for compliance.
Subscription
- $9/mo

Veezoo is a self-service analytics tool that provides instant insights through search, enables data democratization at scale, and allows users to easily tell stories from their data with one-click dashboards.
Freemium
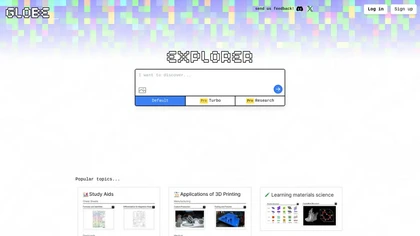
Globe Explorer is an AI-driven platform for data analysis and trend identification, offering robust topic discovery, visual data representations, insightful reports, and collaborative features to enhance research for educators, researchers, and content creators.
Freemium
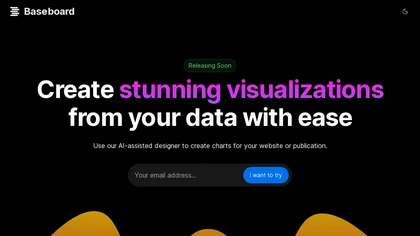
Baseboard is an AI-powered tool that provides quick and efficient data insights with toggle themes, intuitive design, and high-quality visualizations.
Waitlist
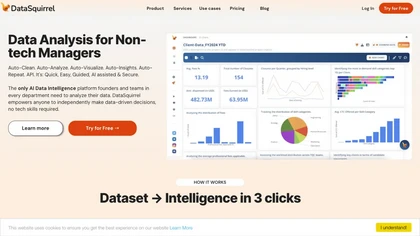
DataSquirrel.ai automates data cleaning, analysis, and visualization for business users, enabling quick chart creation, KPI dashboards, and custom reports without coding. It supports scheduled refreshes, GDPR compliance, and interactive sharing for teams and consultants.
Paid
- $15

Algo transforms structured data into motion graphics, automating end‑to‑end video creation. Teams ingest data, storyboard, and animate via a dashboard, then the cloud renders and distributes live, data‑driven videos for web, social, or broadcast.
Freemium

Explo is a customer-facing analytics platform that streamlines data sharing and reporting for industries like SaaS and e-commerce. Key features include report building, embedded dashboards, and AI-powered analytics, ensuring secure, customizable user experiences.
Freemium

Free AI Graph Maker enables users to create interactive charts and graphs, including bar, pie, and line charts. It supports Gantt charts, flowcharts, and mind maps, facilitating effective data visualization for various sectors like education and finance.
Freemium


Vitral is an AI-driven platform for data visualization and reporting, offering intuitive tools for creating dynamic dashboards and automated reports. It supports real-time collaboration and integrates with various data sources for efficient data presentation.
Subscription

PlotsAlot provides AI-assisted data analysis and visualization, turning CSV/Excel/SPSS/JSON/PDF/image uploads into interactive charts and full-stack dashboards via natural-language queries. Features include conversational data chat, predictive analytics, automated reporting, and reusable dashboards.
Free
- $10/mo
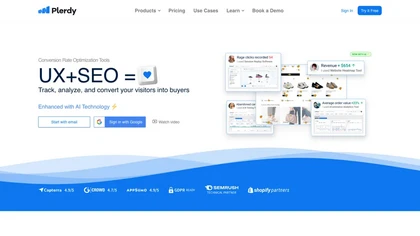
Plerdy visualizes visitor behavior with heatmaps, scrolls, and session replay, spotlights usability problems, and offers pop‑up building, funnel analysis, A/B testing, and SEO checks. AI flags “rage clicks” and links with GA4, Search Console, and Chrome extensions.
Freemium
- $32
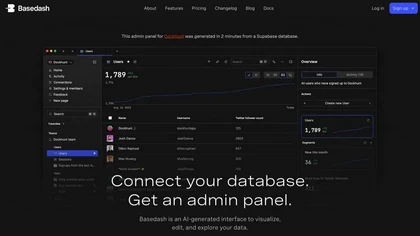
Basedash lets teams ask plain‑English questions of their data warehouses and SaaS sources, automatically generating validated SQL, executing it, and visualizing results in dashboards. It supports 750+ integrations, enforces SOC 2 compliance, and offers an embedding API for internal products.
Paid
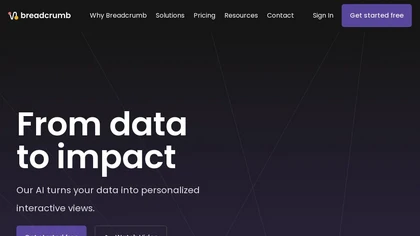
Breadcrumb.ai aggregates disparate data sources, cleans and transforms data, and builds models without code. Marketing teams create interactive dashboards, while sales, ops, and event managers receive real‑time insights and automated reporting across departments.
Free trial
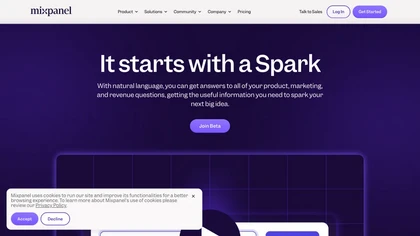
Spark Beta by Mixpanel is an AI tool that uses natural language processing to provide insights on product, marketing, and revenue questions. It offers efficient report generation and CEO insights, while simplifying data management for better decision-making.
Subscription
- $20/mo

Creates investor decks from prompts, URLs, or existing content, applying brand styles and auto‑populating data. Offers 100+ stage‑specific templates, interactive slide features, personalization variables, real‑time collaboration, CRM integration, analytics, and secure export options.
Free trial
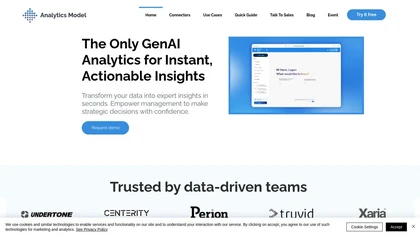
Analytics Model consolidates data from 500+ connectors, supports on‑premises and cloud sources, and offers natural‑language querying to generate charts, pivot tables, and dashboards automatically, enabling non‑coding analysts to obtain instant insights, receive alerts, and integrate via APIs.
Free

Snipowl enables users to create live dashboards from web snapshots, consolidating data from multiple sources. It offers real-time updates, integrates with tools like Google Ads and HubSpot, and includes auto-refreshing data and email reporting features.
Free trial
- $100
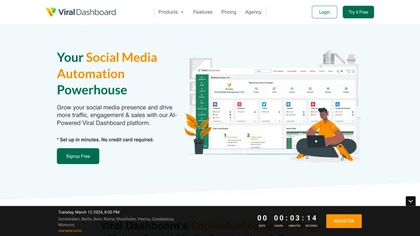
ViralDashboard centralizes social media management across accounts on Facebook, Instagram, LinkedIn, YouTube, Google My Business, Twitter, Pinterest, Telegram, and WordPress. It offers posting, 30‑day scheduling, cross‑network automation, a unified inbox, analytics, AI content discovery, RSS feeds,
Subscription
- $9/mo
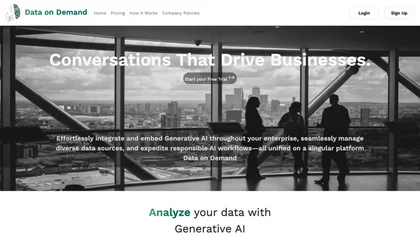
Data On Demand consolidates structured, unstructured, and streaming data into a single source of truth, providing machine‑learning‑driven forecasting, anomaly detection, and decision optimization. It offers real‑time dashboards, AI alerts, and predictive models in a secure, collaborative workspace.
Free trial

TeacherDashboard.ai automates report‑card comments, rubric creation, and assignment grading for K‑12 teachers, using student data to generate personalized feedback and streamline administrative tasks, saving hours weekly and enhancing consistency across evaluations.
Subscription
- $4.99/mo

ChartGPT is an AI tool that facilitates easy creation and customization of multiple chart types for enhanced data visualization. It provides versatility in displaying data through various charts, ensuring clear and captivating presentations for diverse projects.
Freemium
Hawke AI aggregates campaign data into real‑time dashboards, tracks KPIs across accounts, alerts anomalies, offers AI‑driven budget recommendations, forecasting, segmentation, and benchmark comparisons, with customizable reports and controlled sharing for collaborative optimization.
Subscription
- $249/mo
Polar consolidates Shopify, Amazon, and POS data into a single dashboard, leveraging Snowflake for scalable queries. A semantic layer supplies pre‑built metrics, while AI agents deliver tailored insights. Incrementality tests validate marketing impact, and role‑based permissions control team access.
Free trial

SciDraw AI is a scientific illustration and data visualization tool that converts text prompts, sketches, or images into publication-ready figures. It generates editable SVG/PPTX exports, data-driven charts from CSV/Excel, and supports journal style presets and colorblind-friendly palettes for repro
Free trial

vidIQ delivers real‑time YouTube analytics, keyword research, AI‑powered thumbnail creation, and competitive insights. Its AI coach refines titles and descriptions, while clipping tools produce short videos. Available via Chrome or mobile, it boosts visibility and engagement for creators.
Subscription
- $31/mo
DashGPT turns spreadsheets into interactive dashboards without code. Upload data, use a prompt, and AI generates editable charts, tables, and filterable views. Share, embed, and collaborate across teams, suitable for business analytics.
Free trial

Tableau AI is an intelligent analytics platform that combines AI technologies for enhanced data exploration and decision-making. It offers scalable solutions, trusted by organizations, to boost data-driven insights and promote innovative cultures.
Free trial
- $15
DataHawk aggregates daily SKU‑level data, ad metrics, and profitability signals across Amazon, Walmart, and other e‑commerce channels, delivering real‑time dashboards, AI alerts for KPI shifts, ROAS optimization, and multi‑account BI‑integrated reporting.
Subscription
Visionari aggregates customer feedback from email, web, and in‑app sources into a single dashboard. Its AI engine prioritizes requests by impact, pain, and relevance, and allows one‑click roadmap updates that auto‑generate changelogs. Multi‑language filtering and public boards enhance transparency.
Paid
- $19/mo

Cloudairy is a cloud-based collaborative workspace with AI-powered diagramming and project management tools. It enables real-time teamwork with flowcharts, mind maps, Kanban boards, and automated documentation for streamlined workflows.
Free trial
- $8/mo