Visual Analytics
The best 50 Visual Analytics AI tools - Free & Paid
Explore 50 AI for Visual Analytics
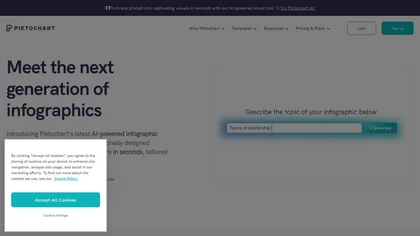
Piktochart is an AI‑powered visual creation platform that turns text into infographics, charts, and videos within seconds. It offers templates, a brand kit, collaborative editing, interactive graphics, and export options for print and digital use.
Freemium
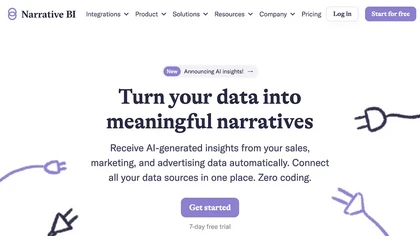
Narrative BI is a generative analytics platform that transforms data into clear, actionable stories for marketing, sales, and product teams.
Freemium
- $90/mo

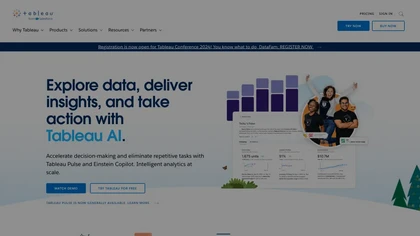
Tableau AI is an intelligent analytics platform that combines AI technologies for enhanced data exploration and decision-making. It offers scalable solutions, trusted by organizations, to boost data-driven insights and promote innovative cultures.
Free trial
- $15

vizGPT turns natural‑language queries and drag‑and‑drop into live dashboards and charts, retaining context for follow‑ups. It includes data tables for profiling and transforms, and design tools that generate Lottie JSON and SVG animations, enabling team collaboration.
Paid
- $10/mo
ChartPixel is an AI tool that generates charts and insights from messy data files or webpages using AI algorithms to clean and engineer new features, provide AI-assisted annotations and statistics to explore patterns and quirks in the data.
Freemium

Graphy transforms raw data from Google Sheets, CSV, Excel, or APIs into AI‑generated charts, auto‑highlighting insights. It supports multiple chart types, branding, annotations, real‑time updates, and export/embed options for marketing, finance, and consulting teams.
Freemium
- $16/mo

Grapha.ai is an AI-enabled data exploration tool that swiftly reveals hidden trends and provides intuitive visualizations & insights from complex datasets without requiring any coding knowledge.
Subscription

Free AI Graph Maker enables users to create interactive charts and graphs, including bar, pie, and line charts. It supports Gantt charts, flowcharts, and mind maps, facilitating effective data visualization for various sectors like education and finance.
Freemium

ChartAI auto‑creates diverse visualizations—mind maps, flowcharts, timelines, Gantt charts, ER diagrams, etc.—by converting data into polished diagrams. It offers templates, quick start, and dataset generation, aiding analysts, researchers, educators, and managers.
Free

ChartGen.ai is an AI chart generator that converts CSV/Excel data or pasted text into presentation-ready visualizations using plain-English prompts. It supports numerous chart types, offers live data sync, and exports in multiple formats with enterprise-grade security.
Freemium


Veezoo is a self-service analytics tool that provides instant insights through search, enables data democratization at scale, and allows users to easily tell stories from their data with one-click dashboards.
Freemium

Julius AI is a data analyst assistant that connects to Excel, Google Sheets, and PostgreSQL to generate bar charts, histograms, heat maps automatically. It offers interactive, customizable visualizations, embeddable into reports, and exports cleaned data for stakeholders.
Freemium


Explo is a customer-facing analytics platform that streamlines data sharing and reporting for industries like SaaS and e-commerce. Key features include report building, embedded dashboards, and AI-powered analytics, ensuring secure, customizable user experiences.
Freemium

SciDraw AI is a scientific illustration and data visualization tool that converts text prompts, sketches, or images into publication-ready figures. It generates editable SVG/PPTX exports, data-driven charts from CSV/Excel, and supports journal style presets and colorblind-friendly palettes for repro
Free trial

Vitral is an AI-driven platform for data visualization and reporting, offering intuitive tools for creating dynamic dashboards and automated reports. It supports real-time collaboration and integrates with various data sources for efficient data presentation.
Subscription

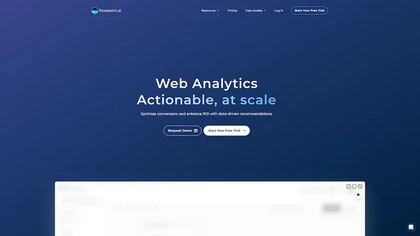
Flowpoint offers a single‑panel dashboard that aggregates key website analytics: top traffic sources, high‑performing pages, real‑time audience by geography, and detailed event timelines. It provides step‑by‑step funnel analysis and session recordings to pinpoint conversion drop‑offs.
Freemium
- $5/mo

Xdash AI offers seamless data analysis, in-depth reporting, and task automation. It excels at uncovering crucial insights from intricate datasets, facilitating informed business decisions.
Freemium
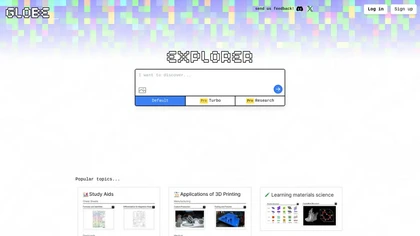
Globe Explorer is an AI-driven platform for data analysis and trend identification, offering robust topic discovery, visual data representations, insightful reports, and collaborative features to enhance research for educators, researchers, and content creators.
Freemium
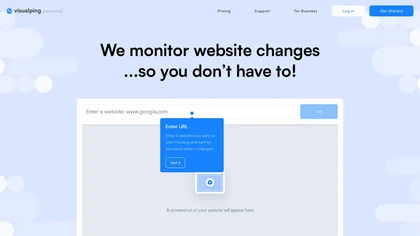
Visualping monitors website changes—visual, textual, or code—in real time, sending alerts via email, Teams, Slack, webhooks, or API. It provides before‑and‑after screenshots, AI‑highlighted significant changes, and easy browser integration for individuals and teams.
Freemium
- $10/mo
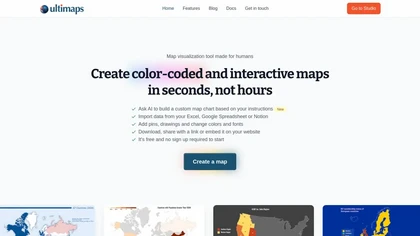
Ultimaps is a user-friendly tool for creating interactive, color-coded maps quickly. It supports data import from various sources and offers features like pins, editable legends, and tooltips, with no sign-up required for basic use.
Freemium

vidIQ delivers real‑time YouTube analytics, keyword research, AI‑powered thumbnail creation, and competitive insights. Its AI coach refines titles and descriptions, while clipping tools produce short videos. Available via Chrome or mobile, it boosts visibility and engagement for creators.
Subscription
- $31/mo

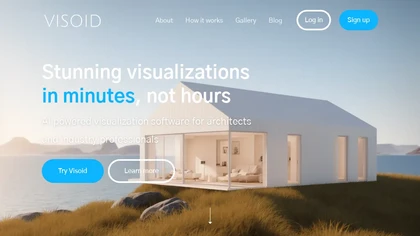
VisualizeAI transforms sketches, photos, or images into high‑quality renders within seconds. Users choose style, color, and theme from over 100 presets or custom options, supporting architecture, interior, product design, and hobby projects for rapid ideation.
Subscription
- $17/mo
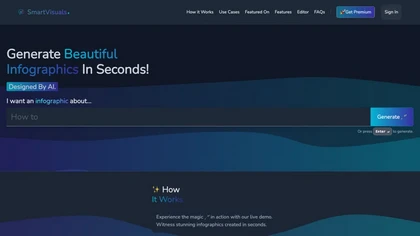
SmartVisuals.app is an AI‑powered infographic creator that produces data visualizations in seconds. With a drag‑and‑drop editor, template library, and export to SVG, PNG, PDF, it offers customization of layout, color, typography, and branding, supporting multiple languages for global use.
Free trial

AI Infographic Generator converts text and data into customizable graphics like infographics and flowcharts. With over 500 templates and multi-language support, it enables editing and downloading in multiple formats, all while supporting 4K resolution.
Freemium

No-Code KPI Dashboard AI by Sqor Value enables users to create customizable KPI dashboards without coding, offering drag-and-drop functionality and integration with various data sources for real-time performance monitoring and strategic planning.
Freemium
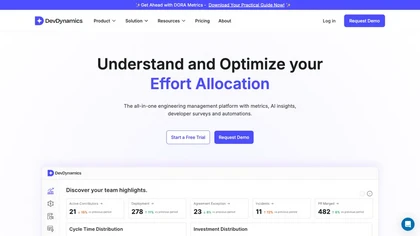
DevDynamics offers real‑time engineering analytics, tracking DORA metrics, forecasting delivery, and aligning output with business goals. It integrates with 20+ tools, provides custom reports, and meets SOC 2 Type II security standards.
Freemium
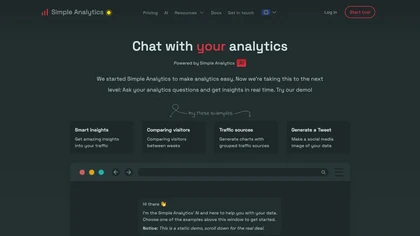
Simple Analytics AI lets website owners and marketers query traffic data with natural language, delivering instant insights, comparison charts, and social‑ready snippets. It provides quick, actionable analysis without complex reporting, ideal for analysts, growth marketers, and small businesses.
Freemium
- $15/mo

AI Infographics converts text into customizable visuals, such as roadmaps and timelines, enhancing data presentation for reports and presentations. Its intuitive interface streamlines the creation process, allowing users to download in formats like PNG and SVG for easy sharing.
Free trial
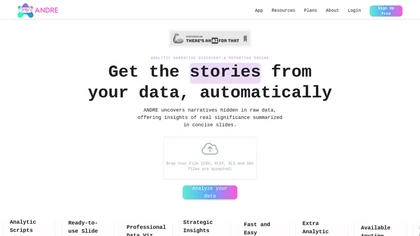
ANDRE converts survey files (CSV, XLSX, SPSS, Google Forms, Typeform) into clean, visual reports in under 15 minutes, automating data cleaning, missing‑value imputation, narrative analysis, and producing a single‑slide insights deck for rapid decision‑making.
Freemium

MyMap turns text prompts into mind maps, flowcharts, SWOT, timelines, and database schemas on an infinite canvas. It auto‑generates and places nodes with real‑time AI context awareness, letting users drag, connect, and reorganize for brainstorming and planning.
Freemium
- $12/mo
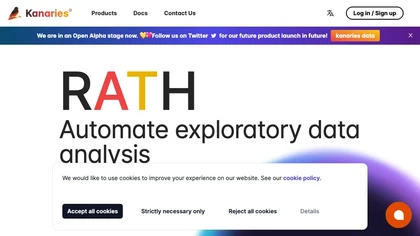
Kanaries transforms raw data into interactive visual insights with AI‑assisted code completion for Pandas, RStudio, and Jupyter. Drag‑and‑drop chart building, natural‑language chat, real‑time collaboration, and offline desktop support streamline the entire exploration workflow across web and desktop
Subscription

Visualizee.ai turns plain‑language descriptions into photorealistic 2K/4K renders and motion videos for architects, designers, and developers. Its conversational AI, multi‑language support, and context‑aware geometry enable quick lighting, material, and batch image transformations.
Freemium
- $15/mo
Edraw Software is a versatile diagramming tool that enables users to create flowcharts, mind maps, and organizational charts with ease. Its drag-and-drop functionality, collaboration features, and support for multiple file formats enhance productivity and integration.
- $59
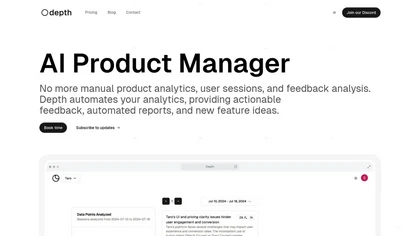
Depth aggregates user sessions, feedback, and key metrics into a single feed, delivering actionable insights, automated reports, and feature ideas for pricing, membership, and video pages. Export to Linear, Jira, Asana, or Notion—no tags or funnel setup needed.
Freemium
- $150/mo
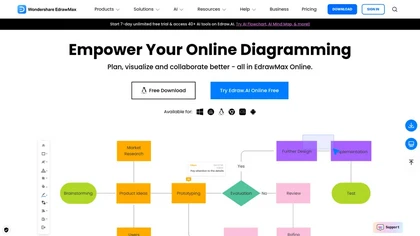
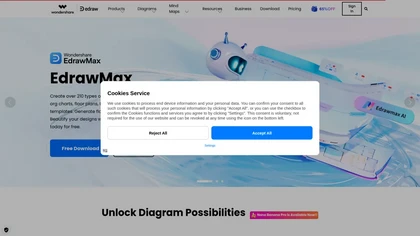
EdrawMax Online is a cloud diagramming platform with 210+ diagram types, including flowcharts, UML, and Gantt charts. It offers drag‑and‑drop editing, real‑time collaboration, 20,000 free templates, 26,000 symbols, and AI tools for diagram, chart, and PPT generation, OCR, and copy‑writing.
Freemium
- $5.33/mo
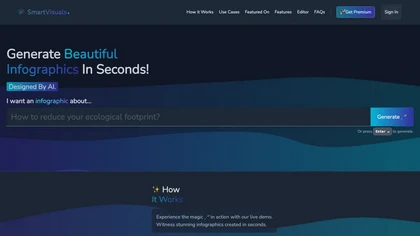
SmartVisuals.app is an AI‑driven infographic generator that creates professional visual summaries in seconds. Its drag‑and‑drop editor, industry templates, and automatic layout suggestions streamline design for marketers, educators, analysts, and teams, supporting exports in PNG, JPEG, or SVG.
Free trial
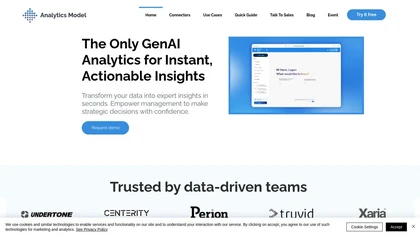
Analytics Model consolidates data from 500+ connectors, supports on‑premises and cloud sources, and offers natural‑language querying to generate charts, pivot tables, and dashboards automatically, enabling non‑coding analysts to obtain instant insights, receive alerts, and integrate via APIs.
Free

Onvo AI revolutionizes data visualization through AI prompts, enabling users to easily generate tailored charts and dashboards without intricate queries. It ensures secure sharing, supports multiple data source integrations, and provides SDKs for smooth product incorporation.
Free trial

Scoop Analytics is an AI-powered platform that analyzes CRM, marketing, and sales data in real-time. It offers customizable reports and dashboards, helping business teams monitor key metrics and make data-driven decisions effectively.
Free trial
Menza is a data analytics platform that transforms unstructured data into actionable insights through over 500 integrations. Its interactive dashboards, user-friendly interface, and strong security features support strategic decision-making for businesses without requiring technical expertise.
AnalysAI is an AI-driven data analytics platform that integrates data from multiple sources, providing predictive analytics, enhanced customer insights, and interactive dashboards to streamline data analysis and support informed decision-making.
Free trial