Cycle Data Galaxy Visualization
The best 42 Cycle Data Galaxy Visualization AI tools - Free & Paid
Explore 42 AI for Cycle Data Galaxy Visualization


Pie Chart Maker lets users quickly create pie, doughnut, and 3‑D charts by entering comma‑separated labels and values. Adjust colors, legend placement, and rotation; export to PNG, JPEG, or SVG. Ideal for students, teachers, designers.
Free

ChartGen.ai is an AI chart generator that converts CSV/Excel data or pasted text into presentation-ready visualizations using plain-English prompts. It supports numerous chart types, offers live data sync, and exports in multiple formats with enterprise-grade security.
Freemium
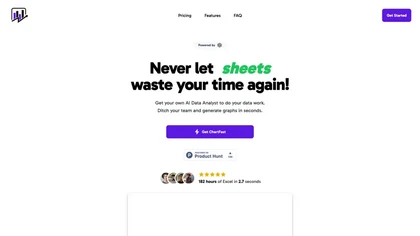
ChartPixel is an AI tool that generates charts and insights from messy data files or webpages using AI algorithms to clean and engineer new features, provide AI-assisted annotations and statistics to explore patterns and quirks in the data.
Freemium
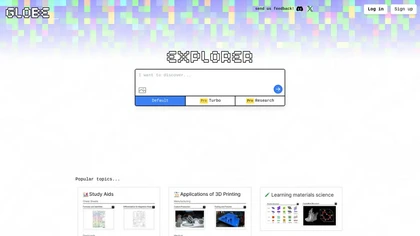
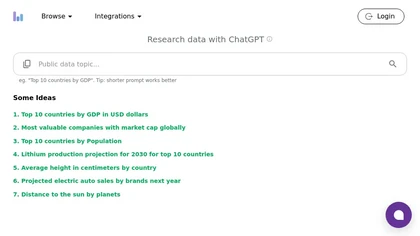
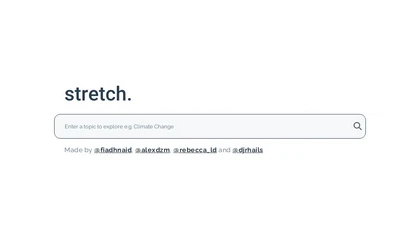
Globe Explorer is an AI-driven platform for data analysis and trend identification, offering robust topic discovery, visual data representations, insightful reports, and collaborative features to enhance research for educators, researchers, and content creators.
Freemium

vizGPT turns natural‑language queries and drag‑and‑drop into live dashboards and charts, retaining context for follow‑ups. It includes data tables for profiling and transforms, and design tools that generate Lottie JSON and SVG animations, enabling team collaboration.
Paid
- $10/mo

Graphy transforms raw data from Google Sheets, CSV, Excel, or APIs into AI‑generated charts, auto‑highlighting insights. It supports multiple chart types, branding, annotations, real‑time updates, and export/embed options for marketing, finance, and consulting teams.
Freemium
- $16/mo

DataChain is a Python SDK and web platform that offers versioned dataset management and lineage tracking on S3, GCS, and Azure, enabling in‑storage data processing, reproducible pipelines, audit trails, collaboration, and secure compliance with SOC‑2 and GDPR.
Freemium
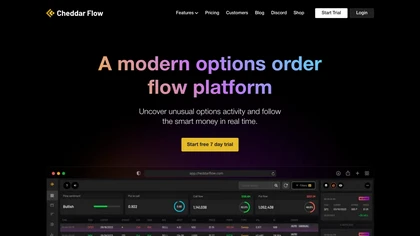
Cheddar Flow delivers real‑time options order flow and high‑frequency data, including dark‑pool and inter‑exchange sweeps. It aggregates gamma exposure, highlights price magnets and support/resistance zones, and AI alerts flag unusual activity for informed trading decisions.
Freemium
- $85/mo

Lava Metrics syncs automatically with HubSpot to deliver real‑time, unified pipeline reports. It tracks deal velocity, sales cycle length, conversion rates, and cohort studies, and lets teams set and monitor monthly revenue targets for data‑driven decision making.
Freemium
- $25
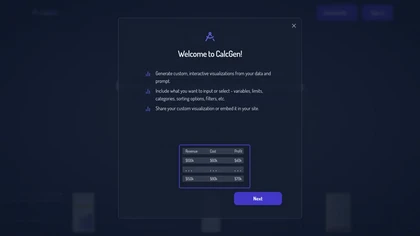
Calcgen AI enables users to create custom interactive charts, graphs, and calculators for data visualization. It includes tools for financial analysis, scientific calculations, and educational purposes, catering to a broad range of professional needs.
Subscription
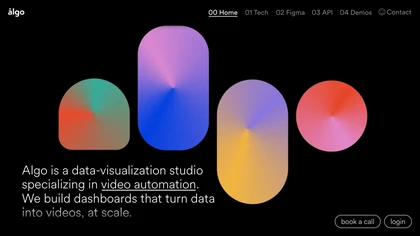
Algo transforms structured data into motion graphics, automating end‑to‑end video creation. Teams ingest data, storyboard, and animate via a dashboard, then the cloud renders and distributes live, data‑driven videos for web, social, or broadcast.
Freemium
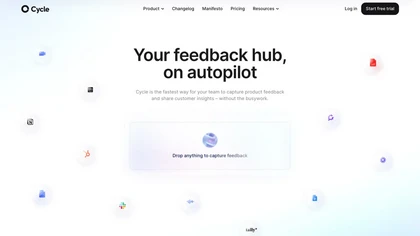
Cycle consolidates feedback from Slack, Zendesk, Intercom, and surveys into a single workspace. Tagging assigns entries to product areas, topics, and roles; CRM sync maintains unified customer context. AI generates dashboards, and real‑time collaboration updates stakeholders via Slack or email.
Freemium
- $9.99/mo

Kanaries transforms raw data into interactive visual insights with AI‑assisted code completion for Pandas, RStudio, and Jupyter. Drag‑and‑drop chart building, natural‑language chat, real‑time collaboration, and offline desktop support streamline the entire exploration workflow across web and desktop
Subscription
GearChain is a no‑code platform that links mobile barcode/NFC scanning to Google Sheets and Excel. It auto‑populates fields, prints labels on‑device, syncs in real time, offers role‑based access, AI‑driven form creation, restock forecasting, and blockchain audit trails for compliance.
Paid
- $20
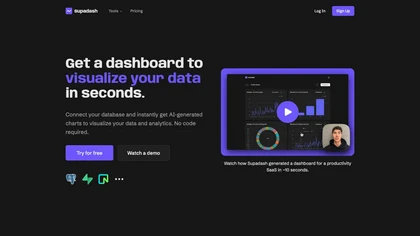
Supadash lets users connect to SQL databases like PostgreSQL or Supabase and automatically turns SELECT results into time‑series and bar charts without manual coding. It supports unlimited charts per project, offers AI‑generated layouts, and stores no user data.
Subscription
- $7/mo
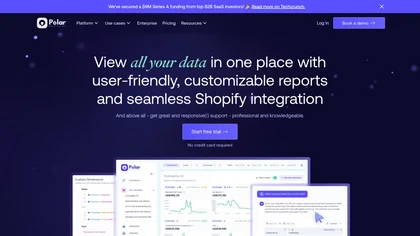
Polar consolidates Shopify, Amazon, and POS data into a single dashboard, leveraging Snowflake for scalable queries. A semantic layer supplies pre‑built metrics, while AI agents deliver tailored insights. Incrementality tests validate marketing impact, and role‑based permissions control team access.
Free trial

Kling AI Motion Control turns a single static image into a realistic, physics‑based animated video. It automatically generates motion paths, applies dynamic effects, and outputs smooth, cinematic clips, supporting batch processing and custom parameters for marketers, designers, and creators.
Subscription

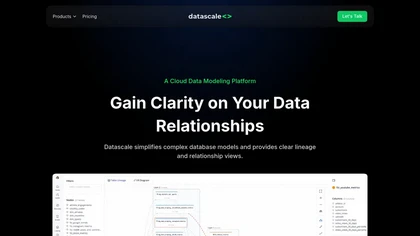
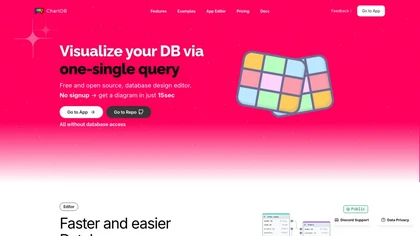
Datascale converts SQL into interactive diagrams, revealing keys and joins without database changes. Engineers trace lineage, design systems, assess normalization, and collaborate with AI to draft specs and refactor plans.
Subscription
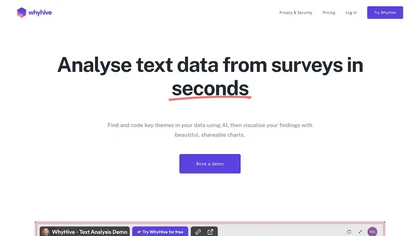
WhyHive transforms CSV/Excel data into visual insights, automatically extracting themes from open‑ended text, tallying occurrences, and generating rule‑based charts. It combines GPT summarisation with data‑faithful charting, enabling rapid dashboards for research, marketing, and impact evaluation.
Freemium
- $29/mo

ChartAI auto‑creates diverse visualizations—mind maps, flowcharts, timelines, Gantt charts, ER diagrams, etc.—by converting data into polished diagrams. It offers templates, quick start, and dataset generation, aiding analysts, researchers, educators, and managers.
Free

ChartGPT is an AI tool that facilitates easy creation and customization of multiple chart types for enhanced data visualization. It provides versatility in displaying data through various charts, ensuring clear and captivating presentations for diverse projects.
Freemium
Solar Explorer simulates the Solar System with accurate orbital and rotational physics, offering 3‑D views, surface textures, time‑evolution modes, and mission replays of Pioneer, Voyager, and New Horizons for educational and research use.
Freemium
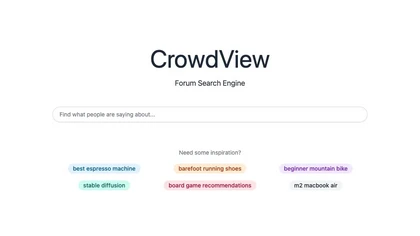
CrowdView is a platform that allows users to view and share real-time video feeds from events around the world.
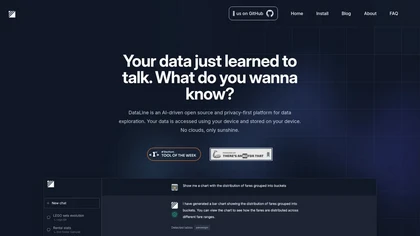
Dataline is an AI-powered data analysis and visualization tool that transforms chat data into structured formats. It supports various databases and promotes privacy by keeping data on user devices, catering to both technical and non-technical users.
Freemium
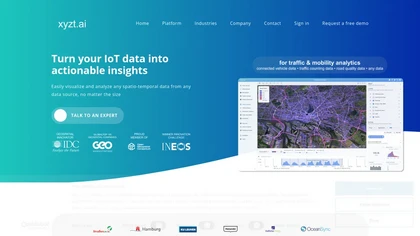
xyzt.ai provides a single‑interface analytics platform that visualizes and analyzes spatio‑temporal traffic, mobility, maritime, and IoT data. It supports raw GPS, map‑matched paths, and aggregated volumes without coding, safeguards data privacy, and offers GenAI queries.
Free
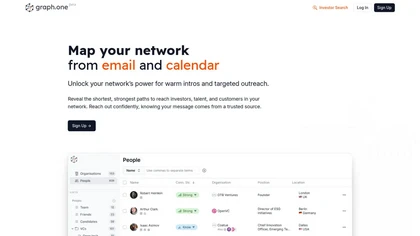
Graph.one is a desktop tool that maps professional networks using email and calendar data, enabling users to visualize connections, optimize fundraising efforts, and secure warm introductions while ensuring data privacy with strong encryption and compliance measures.
Freemium
ChartFast uses GPT‑4o to clean, normalize, and analyze datasets, then instantly generates customizable charts via natural‑language queries. Exportable to CSV/Excel, it supports Python scripts for large‑scale analysis, streamlining workflows for analysts and non‑technical users.
Subscription
- $9/mo

PlotsAlot provides AI-assisted data analysis and visualization, turning CSV/Excel/SPSS/JSON/PDF/image uploads into interactive charts and full-stack dashboards via natural-language queries. Features include conversational data chat, predictive analytics, automated reporting, and reusable dashboards.
Free
- $10/mo

Grapha.ai is an AI-enabled data exploration tool that swiftly reveals hidden trends and provides intuitive visualizations & insights from complex datasets without requiring any coding knowledge.
Subscription
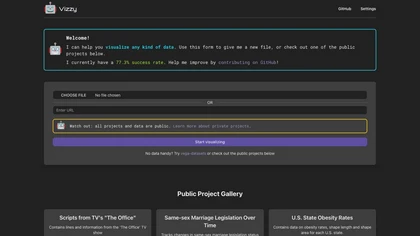
Vizzy turns user data or public datasets into charts and dashboards using large language models. It runs entirely in the browser, stores the OpenAI API key locally, and supports private projects with visibility controls—no coding required.
Paid
Columns.ai is a data visual storytelling AI tool for creating appealing data visual stories. It uses ChatGPT to generate insightful responses to data-related prompts and offers customization options for interactive visualizations.
Freemium
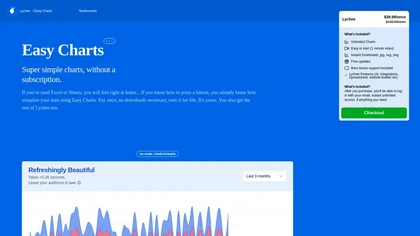
Easy Charts is an AI-powered tool for data visualizations and charts generation without the need for downloads. It offers unlimited chart generation, easy exports, and customization options, making charting effortless for all user levels.
Paid
- $39.99
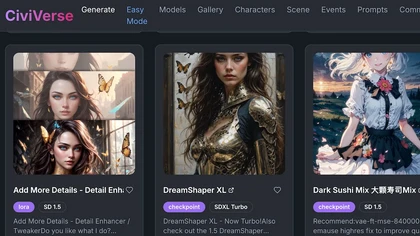
CiviVerse is a text-to-image generator that creates incredibly realistic images with customizable characters, scenes, and events. Users have full control over prompts and LoRAs for highly personalized results.
Free trial
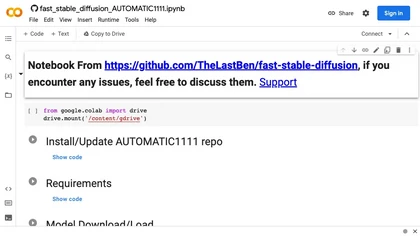
Web-based Dreambooth Google Colab and web UI interface for stable Diffusion.
Free
Lychee is an AI-driven data visualization platform generating graphs from spreadsheets instantly, offering a user-friendly experience for non-technical users without coding skills or complex features.
Paid
Datviz AI is a data visualization tool that leverages OpenAI's language model to analyze complex datasets and generate insightful charts. It offers an intuitive interface for creating diverse visualizations like bar charts, heatmaps, and geomaps to support data-driven decisions.
Freemium

dgi is a data management platform that enables developers to access various data sources securely, automate workflows with natural language, and create interactive applications and analytics dashboards for real-time data analysis and monitoring.
Subscription