Data Visualization
The best 33 Data Visualization AI tools - Free & Paid
Explore 33 AI for Data Visualization
Tableau AI is an intelligent analytics platform that combines AI technologies for enhanced data exploration and decision-making. It offers scalable solutions, trusted by organizations, to boost data-driven insights and promote innovative cultures.
Free trial
- $15

ChartGen.ai is an AI chart generator that converts CSV/Excel data or pasted text into presentation-ready visualizations using plain-English prompts. It supports numerous chart types, offers live data sync, and exports in multiple formats with enterprise-grade security.
Freemium
Plerdy visualizes visitor behavior with heatmaps, scrolls, and session replay, spotlights usability problems, and offers pop‑up building, funnel analysis, A/B testing, and SEO checks. AI flags “rage clicks” and links with GA4, Search Console, and Chrome extensions.
Freemium
- $32
Simple Analytics delivers privacy‑first web analytics, capturing only non‑personal data. It offers real‑time dashboards, goal and event tracking, AI chat support, encrypted data, and integrations with GTM, WordPress, and visualization tools.
Freemium
- $15/mo

Pie Chart Maker lets users quickly create pie, doughnut, and 3‑D charts by entering comma‑separated labels and values. Adjust colors, legend placement, and rotation; export to PNG, JPEG, or SVG. Ideal for students, teachers, designers.
Free

vizGPT turns natural‑language queries and drag‑and‑drop into live dashboards and charts, retaining context for follow‑ups. It includes data tables for profiling and transforms, and design tools that generate Lottie JSON and SVG animations, enabling team collaboration.
Paid
- $10/mo

SciDraw AI is a scientific illustration and data visualization tool that converts text prompts, sketches, or images into publication-ready figures. It generates editable SVG/PPTX exports, data-driven charts from CSV/Excel, and supports journal style presets and colorblind-friendly palettes for repro
Free trial

Free AI Graph Maker enables users to create interactive charts and graphs, including bar, pie, and line charts. It supports Gantt charts, flowcharts, and mind maps, facilitating effective data visualization for various sectors like education and finance.
Freemium
Menza is a data analytics platform that transforms unstructured data into actionable insights through over 500 integrations. Its interactive dashboards, user-friendly interface, and strong security features support strategic decision-making for businesses without requiring technical expertise.
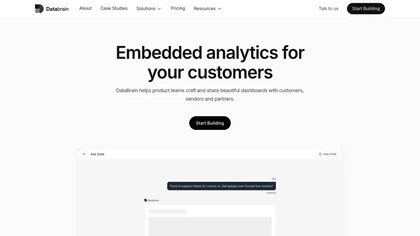
DataBrain is an embedded analytics platform that gives product teams and developers interactive dashboards, self‑service reporting, and AI‑powered insights. Its low‑code interface and SDK let users customize visualizations, connect to multiple data sources, and embed analytics into applications.
Subscription
- $999/mo
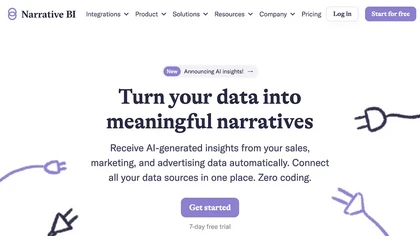
Narrative BI is a generative analytics platform that transforms data into clear, actionable stories for marketing, sales, and product teams.
Freemium
- $90/mo
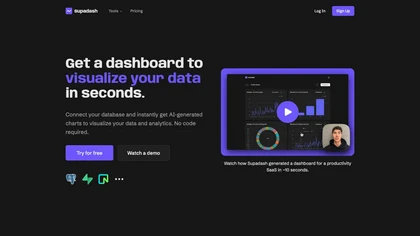
Supadash lets users connect to SQL databases like PostgreSQL or Supabase and automatically turns SELECT results into time‑series and bar charts without manual coding. It supports unlimited charts per project, offers AI‑generated layouts, and stores no user data.
Subscription
- $7/mo
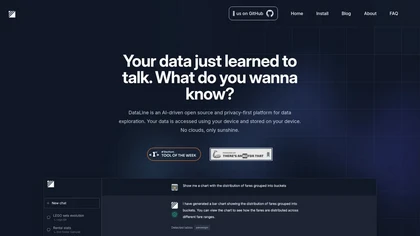
Dataline is an AI-powered data analysis and visualization tool that transforms chat data into structured formats. It supports various databases and promotes privacy by keeping data on user devices, catering to both technical and non-technical users.
Freemium
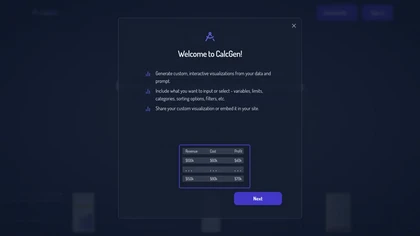
Calcgen AI enables users to create custom interactive charts, graphs, and calculators for data visualization. It includes tools for financial analysis, scientific calculations, and educational purposes, catering to a broad range of professional needs.
Subscription
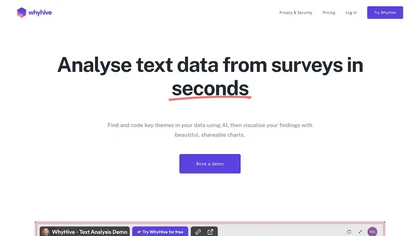
WhyHive transforms CSV/Excel data into visual insights, automatically extracting themes from open‑ended text, tallying occurrences, and generating rule‑based charts. It combines GPT summarisation with data‑faithful charting, enabling rapid dashboards for research, marketing, and impact evaluation.
Freemium
- $29/mo
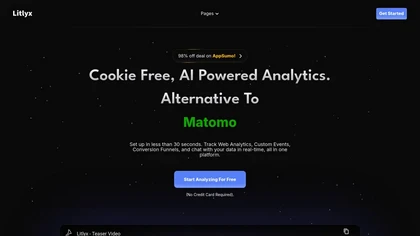
Litlyx is a GDPR-compliant analytics dashboard that tracks key web metrics, supports real-time monitoring of custom events, and features an intuitive chat interface for generating charts and reports, all with simple code integration and no cookies.
Freemium
- $29.99/mo

Bilbo is an AI assistant for Metabase users that simplifies data interaction through natural language queries, enabling effortless report generation, data visualization, and collaboration without requiring advanced data science skills, streamlining the data analysis process.
Freemium
- $199/mo
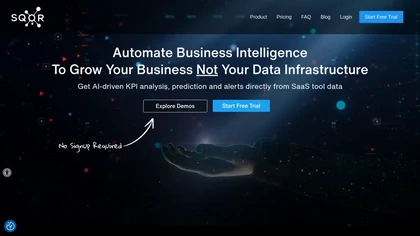
No-Code KPI Dashboard AI by Sqor Value enables users to create customizable KPI dashboards without coding, offering drag-and-drop functionality and integration with various data sources for real-time performance monitoring and strategic planning.
Freemium

Grapha.ai is an AI-enabled data exploration tool that swiftly reveals hidden trends and provides intuitive visualizations & insights from complex datasets without requiring any coding knowledge.
Subscription
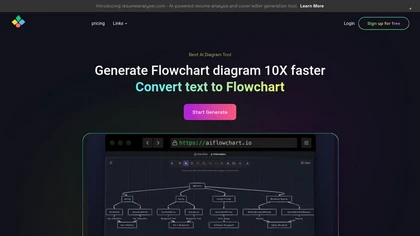
AI Flowchart is a diagram generation tool that creates various visual formats, such as flowcharts and pie charts, from different data sources. It offers customization options and an iterative recreation feature for enhanced diagram design efficiency.
Freemium
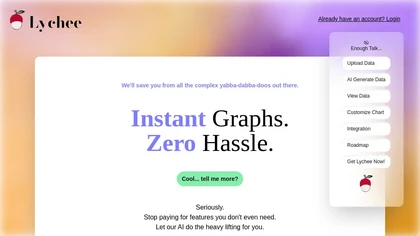
Lychee is an AI-driven data visualization platform generating graphs from spreadsheets instantly, offering a user-friendly experience for non-technical users without coding skills or complex features.
Paid
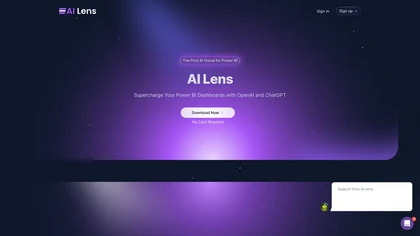
AI Lens is a Power BI visual that lets users ask natural‑language questions about live data and receive instant answers within dashboards. It integrates seamlessly, supports real‑time processing, offers branding customization, granular data‑source controls, and uses OpenAI’s API without storing quer
Freemium

Lazy Admin" is an AI reporting tool for Salesforce offering real-time responses in human language, data protection, AI search capabilities, customizable reporting, and effortless data visualization. It saves time by providing instant insights and enhancing productivity.
Free trial
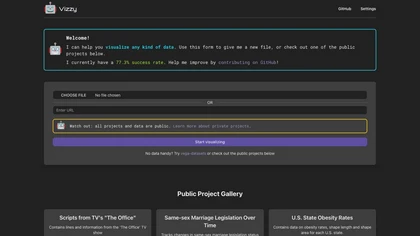
Vizzy turns user data or public datasets into charts and dashboards using large language models. It runs entirely in the browser, stores the OpenAI API key locally, and supports private projects with visibility controls—no coding required.
Paid
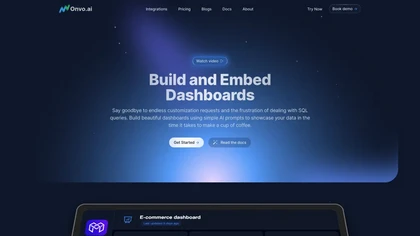
Onvo AI revolutionizes data visualization through AI prompts, enabling users to easily generate tailored charts and dashboards without intricate queries. It ensures secure sharing, supports multiple data source integrations, and provides SDKs for smooth product incorporation.
Free trial
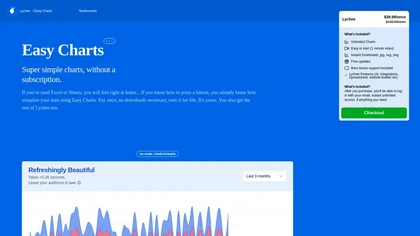
Easy Charts is an AI-powered tool for data visualizations and charts generation without the need for downloads. It offers unlimited chart generation, easy exports, and customization options, making charting effortless for all user levels.
Paid
- $39.99
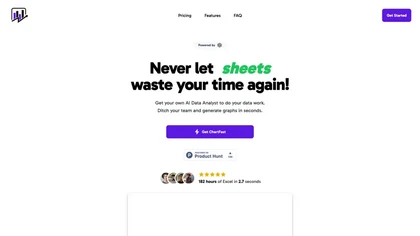
ChartFast uses GPT‑4o to clean, normalize, and analyze datasets, then instantly generates customizable charts via natural‑language queries. Exportable to CSV/Excel, it supports Python scripts for large‑scale analysis, streamlining workflows for analysts and non‑technical users.
Subscription
- $9/mo
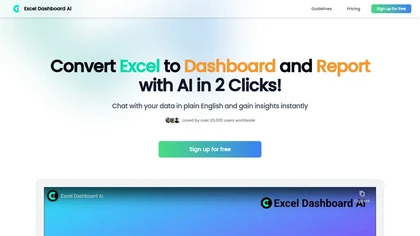
ExcelDashboard AI transforms Excel data into interactive dashboards and reports with minimal effort. Users can generate insights using plain English, automate visualizations, and customize analyses, making it suitable for both beginners and experienced data analysts.
Free trial
Monitr is an AI‑powered analytics platform that connects to PostgreSQL or APIs, converts natural language into optimized SQL, and auto‑generates real‑time dashboards. It supports collaborative workspaces and enterprise‑grade security for secure, efficient data exploration.
Subscription
- $9/mo
Snipowl enables users to create live dashboards from web snapshots, consolidating data from multiple sources. It offers real-time updates, integrates with tools like Google Ads and HubSpot, and includes auto-refreshing data and email reporting features.
Free trial
- $100
Datviz AI is a data visualization tool that leverages OpenAI's language model to analyze complex datasets and generate insightful charts. It offers an intuitive interface for creating diverse visualizations like bar charts, heatmaps, and geomaps to support data-driven decisions.
Freemium

dgi is a data management platform that enables developers to access various data sources securely, automate workflows with natural language, and create interactive applications and analytics dashboards for real-time data analysis and monitoring.
Subscription

Vitral is an AI-driven platform for data visualization and reporting, offering intuitive tools for creating dynamic dashboards and automated reports. It supports real-time collaboration and integrates with various data sources for efficient data presentation.
Subscription