
Top 22 Vizzy Alternatives in 2026
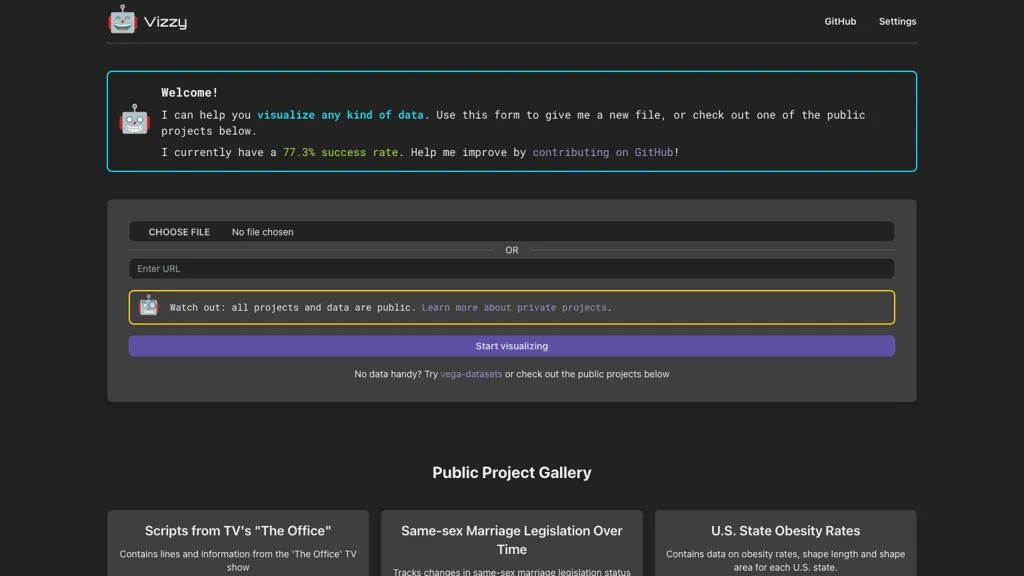
No user reviews yet PaidVizzy turns user data or public datasets into charts and dashboards using large language models. It runs entirely in the browser, stores the OpenAI API key locally, and supports private projects with visibility controls—no coding required.
We've ranked 22 Vizzy alternatives, including 14 with a free plan. Rankings are based on feature coverage and user feedbacks.
Top-rated alternatives include vizGPT, ChartGen.ai, and Bricks.
22 Vizzy Alternatives & Competitors, Ranked by User Reviews
Click Compare on any tool to compare it side-by-side with Vizzy.
 #1
vizGPT
#1
vizGPT
vizGPT turns natural‑language queries and drag‑and‑drop into live dashboards and charts, retaining context for follow‑ups. It includes data tables for profiling and transforms, and design tools that generate Lottie JSON and SVG animations, enabling team collaboration.
 #2
ChartGen.ai
#2
ChartGen.ai
ChartGen.ai is an AI chart generator that converts CSV/Excel data or pasted text into presentation-ready visualizations using plain-English prompts. It supports numerous chart types, offers live data sync, and exports in multiple formats with enterprise-grade security.
 #3
Bricks
#3
Bricks
Bricks AI transforms CSV, Excel, Google Sheets, and database files into instant interactive dashboards and reports. It auto‑creates charts, lets users edit data via natural‑language commands, refreshes with one click, and offers reusable templates with encrypted privacy.
 #4
AI graph maker
#4
AI graph maker
Free AI Graph Maker enables users to create interactive charts and graphs, including bar, pie, and line charts. It supports Gantt charts, flowcharts, and mind maps, facilitating effective data visualization for various sectors like education and finance.
 #5
datviz ai
#5
datviz ai
Datviz AI is a data visualization tool that leverages OpenAI's language model to analyze complex datasets and generate insightful charts. It offers an intuitive interface for creating diverse visualizations like bar charts, heatmaps, and geomaps to support data-driven decisions.
 #6
DataBrain
#6
DataBrain
DataBrain is an embedded analytics platform that gives product teams and developers interactive dashboards, self‑service reporting, and AI‑powered insights. Its low‑code interface and SDK let users customize visualizations, connect to multiple data sources, and embed analytics into applications.
- Catch deals before they expire
- Unlock tools matched to you
- Show off your AI stacks
Already a member? Sign in
 #7
ChatLLM
#7
ChatLLM
AnalysAI is an AI-driven data analytics platform that integrates data from multiple sources, providing predictive analytics, enhanced customer insights, and interactive dashboards to streamline data analysis and support informed decision-making.
 #8
Analytics Model
#8
Analytics Model
Analytics Model consolidates data from 500+ connectors, supports on‑premises and cloud sources, and offers natural‑language querying to generate charts, pivot tables, and dashboards automatically, enabling non‑coding analysts to obtain instant insights, receive alerts, and integrate via APIs.
 #9
Breadcrumb.ai
#9
Breadcrumb.ai
Breadcrumb.ai aggregates disparate data sources, cleans and transforms data, and builds models without code. Marketing teams create interactive dashboards, while sales, ops, and event managers receive real‑time insights and automated reporting across departments.
 #10
SaaSpec
#10
SaaSpec
SaaSpec tracks pay as you go LLM API usage and per user token consumption, calculates individual OpenAI token costs, and exports monthly CSVs for finance and engineering. CSVs convert to Stripe invoices for billing, cost allocation and reporting.
 #11
Excel Dashboard Ai
#11
Excel Dashboard Ai
ExcelDashboard AI transforms Excel data into interactive dashboards and reports with minimal effort. Users can generate insights using plain English, automate visualizations, and customize analyses, making it suitable for both beginners and experienced data analysts.
 #12
Onvo AI
#12
Onvo AI
Onvo AI revolutionizes data visualization through AI prompts, enabling users to easily generate tailored charts and dashboards without intricate queries. It ensures secure sharing, supports multiple data source integrations, and provides SDKs for smooth product incorporation.
 #13
Market Genius AI
#13
Market Genius AI
Market‑Genius.ai turns natural‑language questions into interactive dashboards with real‑time data on equities, crypto, and macro assets. It offers 16 chart types, drag‑and‑drop layout, live watchlists, company deep dives, AI insights, and export options.
 #14
plotsalot.app
#14
plotsalot.app
PlotsAlot provides AI-assisted data analysis and visualization, turning CSV/Excel/SPSS/JSON/PDF/image uploads into interactive charts and full-stack dashboards via natural-language queries. Features include conversational data chat, predictive analytics, automated reporting, and reusable dashboards.
 #15
Power BI AI Lens
#15
Power BI AI Lens
AI Lens is a Power BI visual that lets users ask natural‑language questions about live data and receive instant answers within dashboards. It integrates seamlessly, supports real‑time processing, offers branding customization, granular data‑source controls, and uses OpenAI’s API without storing queries.
 #16
Grapha AI
#16
Grapha AI
Grapha.ai is an AI-enabled data exploration tool that swiftly reveals hidden trends and provides intuitive visualizations & insights from complex datasets without requiring any coding knowledge.
 #17
Client Reports
#17
Client Reports
ClientReports.ai automates report creation from data import to export. It uses natural language generation for full sections, executive summaries, and customizable layouts with charts. Secure collaboration and single‑click export to PDF, Word, or Google Docs support multiple industries.
 #18
Spreadsite
#18
Spreadsite
DashGPT turns spreadsheets into interactive dashboards without code. Upload data, use a prompt, and AI generates editable charts, tables, and filterable views. Share, embed, and collaborate across teams, suitable for business analytics.
 #19
Vitral AI
#19
Vitral AI
Vitral is an AI-driven platform for data visualization and reporting, offering intuitive tools for creating dynamic dashboards and automated reports. It supports real-time collaboration and integrates with various data sources for efficient data presentation.
 #20
Easy Charts
#20
Easy Charts
Easy Charts is an AI-powered tool for data visualizations and charts generation without the need for downloads. It offers unlimited chart generation, easy exports, and customization options, making charting effortless for all user levels.
 #21
Chartfast
#21
Chartfast
ChartFast uses GPT‑4o to clean, normalize, and analyze datasets, then instantly generates customizable charts via natural‑language queries. Exportable to CSV/Excel, it supports Python scripts for large‑scale analysis, streamlining workflows for analysts and non‑technical users.
 #22
FreeAIChatbot
#22
FreeAIChatbot
FreeAIChatbot.org is an interactive platform for localized AI conversations, image generation, and file analysis. It ensures data privacy by storing chats locally and features multiple AI models for varied user needs. Login is required for access.
Frequently Asked Questions
Why look for Vizzy alternatives?
Common reasons users switch from Vizzy:
- Cost: Vizzy is a Paid tool — users often look for more affordable or free options.
- Feature gaps: teams needing specific capabilities like Generate Visualizations may find a more focused alternative better suited to their workflow.
- Flexibility: exploring alternatives helps find tools that better match your team size, integrations, and budget.
What is the best alternative to Vizzy?
Based on 5 user reviews, vizGPT (60% positive) ranks as the top Vizzy alternative. vizGPT turns natural‑language queries and drag‑and‑drop into live dashboards and charts, retaining context for follow‑ups. It includes data tables for It is available on a Paid plan starting from $10/mo.
How do the top Vizzy alternatives compare?
| Tool | Pricing | Starting Price | User Rating |
|---|---|---|---|
| Vizzy this tool | Paid | — | — |
| vizGPT | Paid | $10/mo | 60% (5) |
| ChartGen.ai | Freemium | — | 80% (5) |
| Bricks | Freemium | $25/mo | — |
| AI graph maker | Freemium | — | 50% (1) |
| datviz ai | Freemium | — | 87.5% (8) |
Are there free Vizzy alternatives?
Yes, 14 free alternatives found in our list: ChartGen.ai, Bricks, AI graph maker. and 11 more — use the pricing filter above to see them all.
What should I look for in a Vizzy alternative?
- Core capabilities: confirm the tool supports Generate Visualizations, Analyze Data, Build Dashboards.
- Pricing transparency: look for clear free plan, trial period, or tiered pricing — avoid tools that hide costs.
- User reviews: check both the satisfaction percentage and the number of reviews; a high score from few users is less reliable.
- Integrations: verify it connects with your existing stack before committing.
- Support and updates: active development and responsive support are strong signals of a maintained product.
Which Vizzy alternative has the highest user rating?
Onvo AI has the highest satisfaction score among Vizzy alternatives, with 100% positive from 1 user review. It is available on a Free trial plan.
What are Vizzy alternatives used for?
- Generate Visualizations
- Analyze Data
- Build Dashboards
- Upload Files
- Connect Apis