
Compare Diagramming vs Qlerify Process and Data Modeler ⚖️
Diagramming has a rating of 5 based on 0 of ratings and Qlerify Process and Data Modeler has a rating of 4.8 based on 8 of ratings. Compare the similarities and differences between software options with real user reviews focused on features, ease of use, customer service, and value for money.
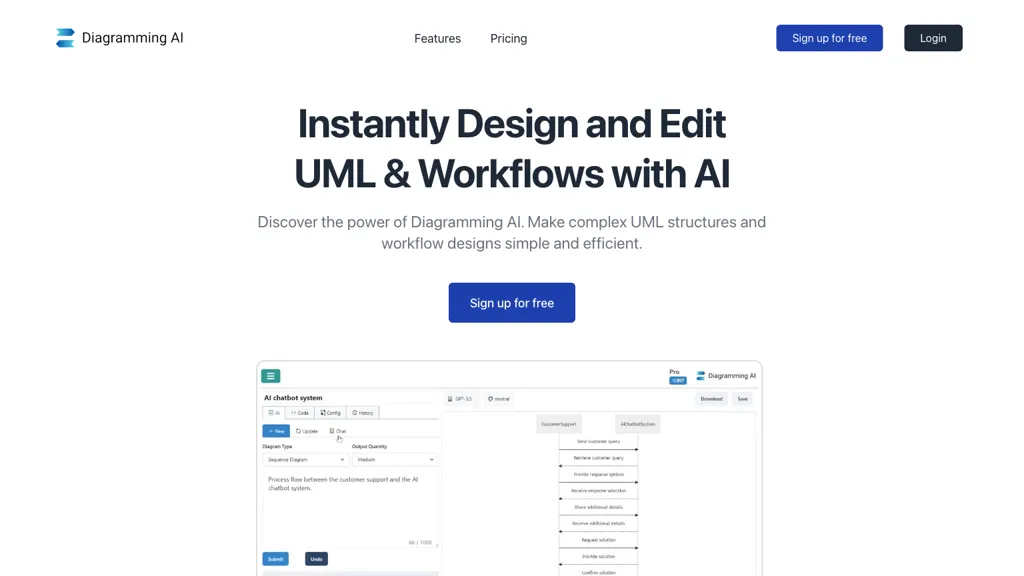

📝 Diagramming Description
Diagramming AI is an AI-powered tool that simplifies UML & workflow creation with intuitive editing, customizable themes, & a vast template library.
📝 Qlerify Process and Data Modeler Description
Qlerify is an AI-powered business process modeling tool that helps transformation teams align their work across different departments. Create baseline workflows, improve them using AI, visually align teams, create internal alignment, and document critical business processes. Export artifacts in CSV, JSON, and PDF. Native integration with Jira.
Qlerify Process and Data Modeler Details
Pricing: Freemium Check details
Tagged: Project management Business
Diagramming Key Features
Qlerify Process and Data Modeler Key Features
👍 Diagramming Ratings
5 0 ratings👍 Qlerify Process and Data Modeler Ratings
4.8 8 ratings
Value for money:
5.0
Ease of Use:
4.9
Performance:
4.9
Features:
4.6
Support:
4.9