
Compare Columns vs Narrative BI ⚖️
Columns has a rating of 5 based on 0 of ratings and Narrative BI has a rating of 5 based on 1 of ratings. Compare the similarities and differences between software options with real user reviews focused on features, ease of use, customer service, and value for money.

📝 Columns Description
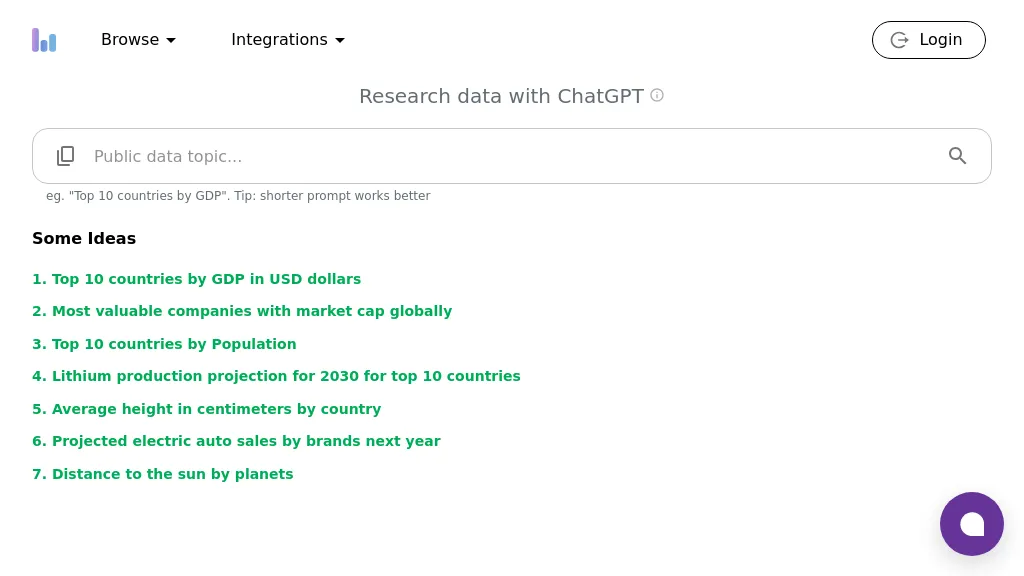
Columns.ai is a data visual storytelling AI tool for creating appealing data visual stories. It uses ChatGPT to generate insightful responses to data-related prompts and offers customization options for interactive visualizations.
📝 Narrative BI Description
Narrative BI is a generative analytics platform that transforms data into clear, actionable stories for marketing, sales, and product teams.
Columns Key Features
✨ Create engaging data stories
✨ Insights from prompts and queries
✨ Customize graph settings
✨ Create interactive visualizations
✨ Collaborate within community
✨ Insights from prompts and queries
✨ Customize graph settings
✨ Create interactive visualizations
✨ Collaborate within community
Narrative BI Key Features
✨ All the metrics under one roof
✨ Natural language generation
✨ Anomaly detection
✨ Scheduled reports
✨ AI driven insights
✨ Slack chatbot
✨ Multiple data channels integrations
✨ Natural language generation
✨ Anomaly detection
✨ Scheduled reports
✨ AI driven insights
✨ Slack chatbot
✨ Multiple data channels integrations
👍 Columns Ratings
5 0 ratings👍 Narrative BI Ratings
5 1 ratings
Value for money:
5.0
Ease of Use:
5.0
Performance:
5.0
Features:
5.0
Support:
5.0